Spring Boot Monitoring aims to provide real-time insights into various aspects of a Spring Boot application. Spring Boot provides useful libraries like the Spring Boot Actuator and Micrometer to aid in monitoring. But in order to set up effective monitoring, you need to use a tool where you can send the monitoring data for storage and visualization.

In this tutorial, we cover:
- A Brief Overview of Spring Boot
- A Brief Overview of OpenTelemetry and SigNoz
- 5 things you must know about monitoring Spring Boot with SigNoz
- Signals: Metrics vs Traces vs Logs
- Configuring OpenTelemetry for Spring Boot Application
- Monitoring with SigNoz
- Manual Instrumentation in Spring Boot Applications
- Important Metrics that Matter for Spring Boot Application
- Conclusion
- Further Reading
In this tutorial, you will learn how to monitor a Spring Boot application with SigNoz and OpenTelemetry. You will learn how to use three signals - metrics, traces, and logs for a robust monitoring setup.
A Brief Overview of Spring Boot
Spring Boot has become one of the most popular frameworks for building micro-services in Java due to the focus on building business code and allowing the developers to focus less on building the supporting application server. Additionally, the ease of integrating with Docker and other container frameworks such as PodMan and Containerd makes Spring Boot a popular choice for containerized micro-services.
Instrumenting Spring Boot with the OpenTelemetry Java Agent requires some minor changes to your application to add the OpenTelemetry Java dependencies and logging configuration to ensure that we have the best telemetry possible coming from your Spring Boot application.
A Brief Overview of OpenTelemetry and SigNoz
OpenTelemetry is a set of APIs, SDKs, libraries, and integrations aiming to standardize the generation, collection, and management of telemetry data(logs, metrics, and traces). It is backed by the Cloud Native Computing Foundation and is the leading open-source project in the observability domain.
The data you collect with OpenTelemetry is vendor-agnostic and can be exported in many formats. Telemetry data has become critical in observing the state of distributed systems. With microservices and polyglot architectures, there was a need to have a global standard. OpenTelemetry aims to fill that space and is doing a great job at it thus far.
Once the data is collected, it needs to be sent to a backend. That’s where SigNoz comes into the picture. SigNoz is an open-source OpenTelemetry-native APM that provides logs, metrics and traces under a single pane of glass.
5 things you must know about monitoring Spring Boot with SigNoz
- SigNoz is an open-source and commercially supported OpenTelemetry APM platform for monitoring metrics, logs, and traces.
- Spring Boot and OpenTelemetry are able to provide all three signals to SigNoz.
- There is no need to manually deploy WAR files as this is managed by Spring Boot.
- Instrumentation is achieved by embedding the OpenTelemetry Java Agent (using javaagentpath flag) and configuring the collector variables.
- Changes are required to your Logback.xml to add span and trace attributes to logs for trace-to-log correlation.
Signals: Metrics vs Traces vs Logs
Signals are the data sources that we can use to observe applications and services using OpenTelemetry. OpenTelemetry supports three types of signals (metrics, logs, traces), each providing a lens into the application's performance.
Metrics
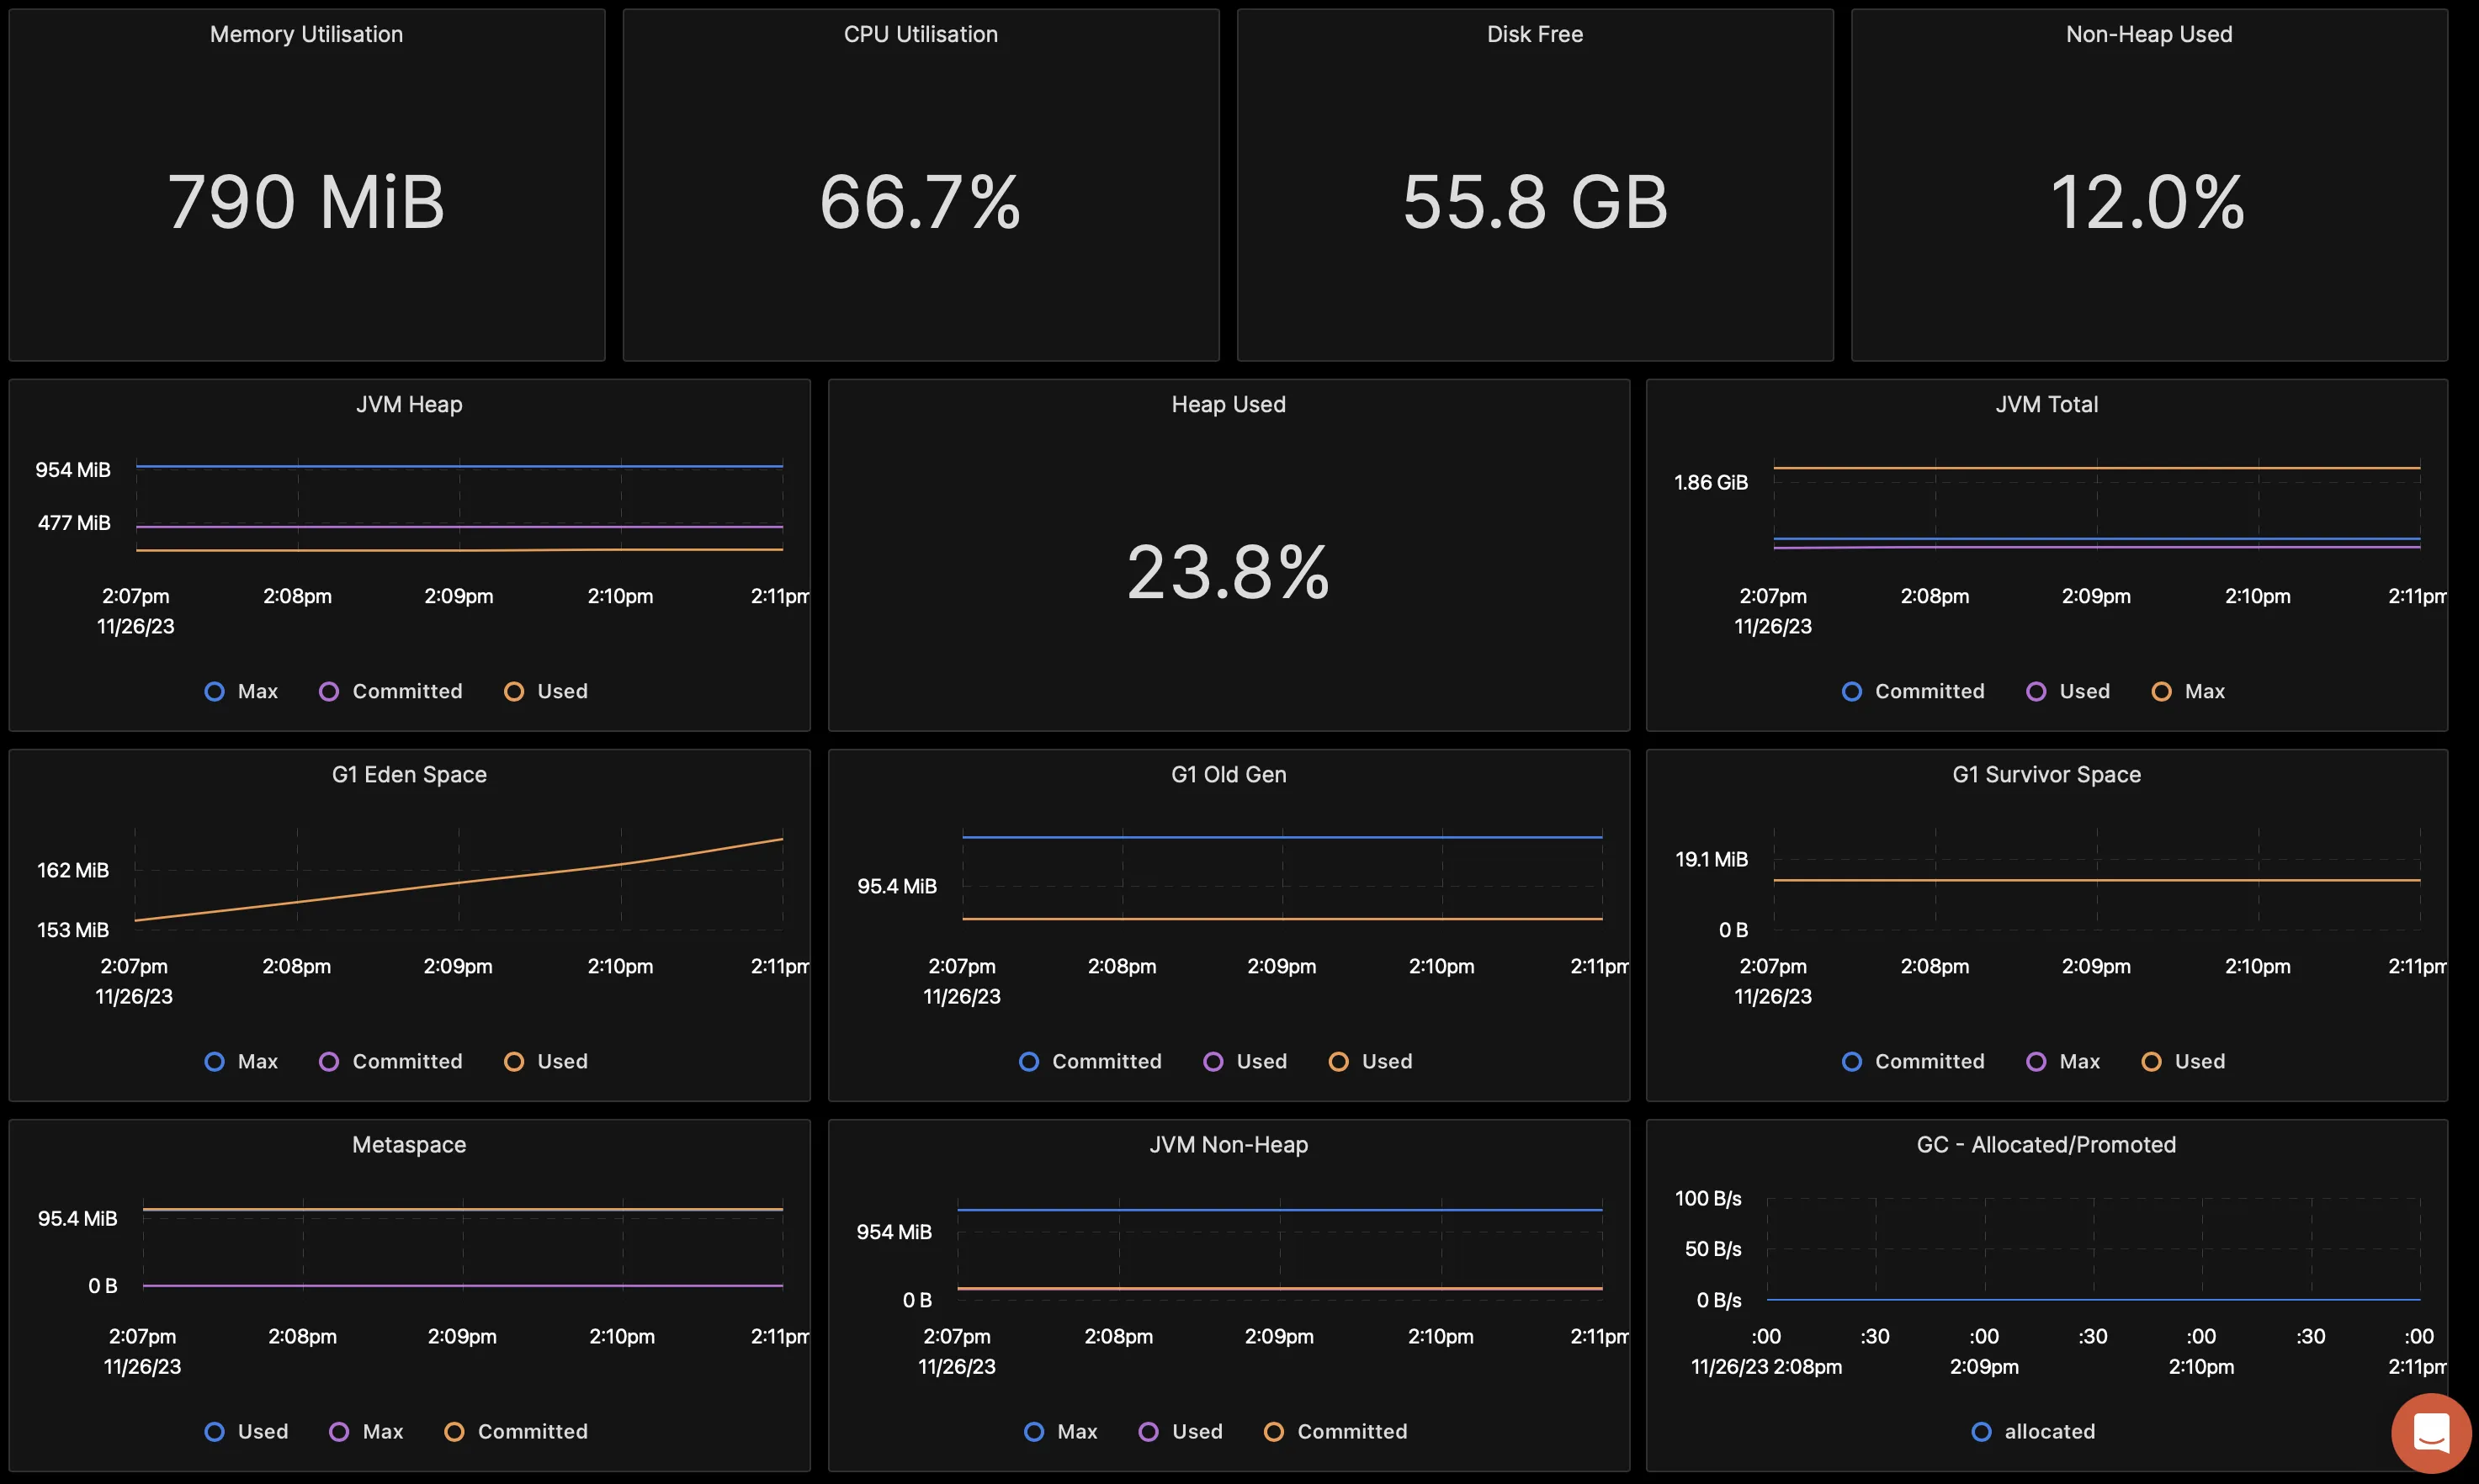
Metrics are typically point-in-time values we can gather from systems that give us utilization and saturation data. Metrics are typically numerical values or status that would be collected via an agent, SNMP, WMI, or APIs. You can download the dashboard below here.
Traces
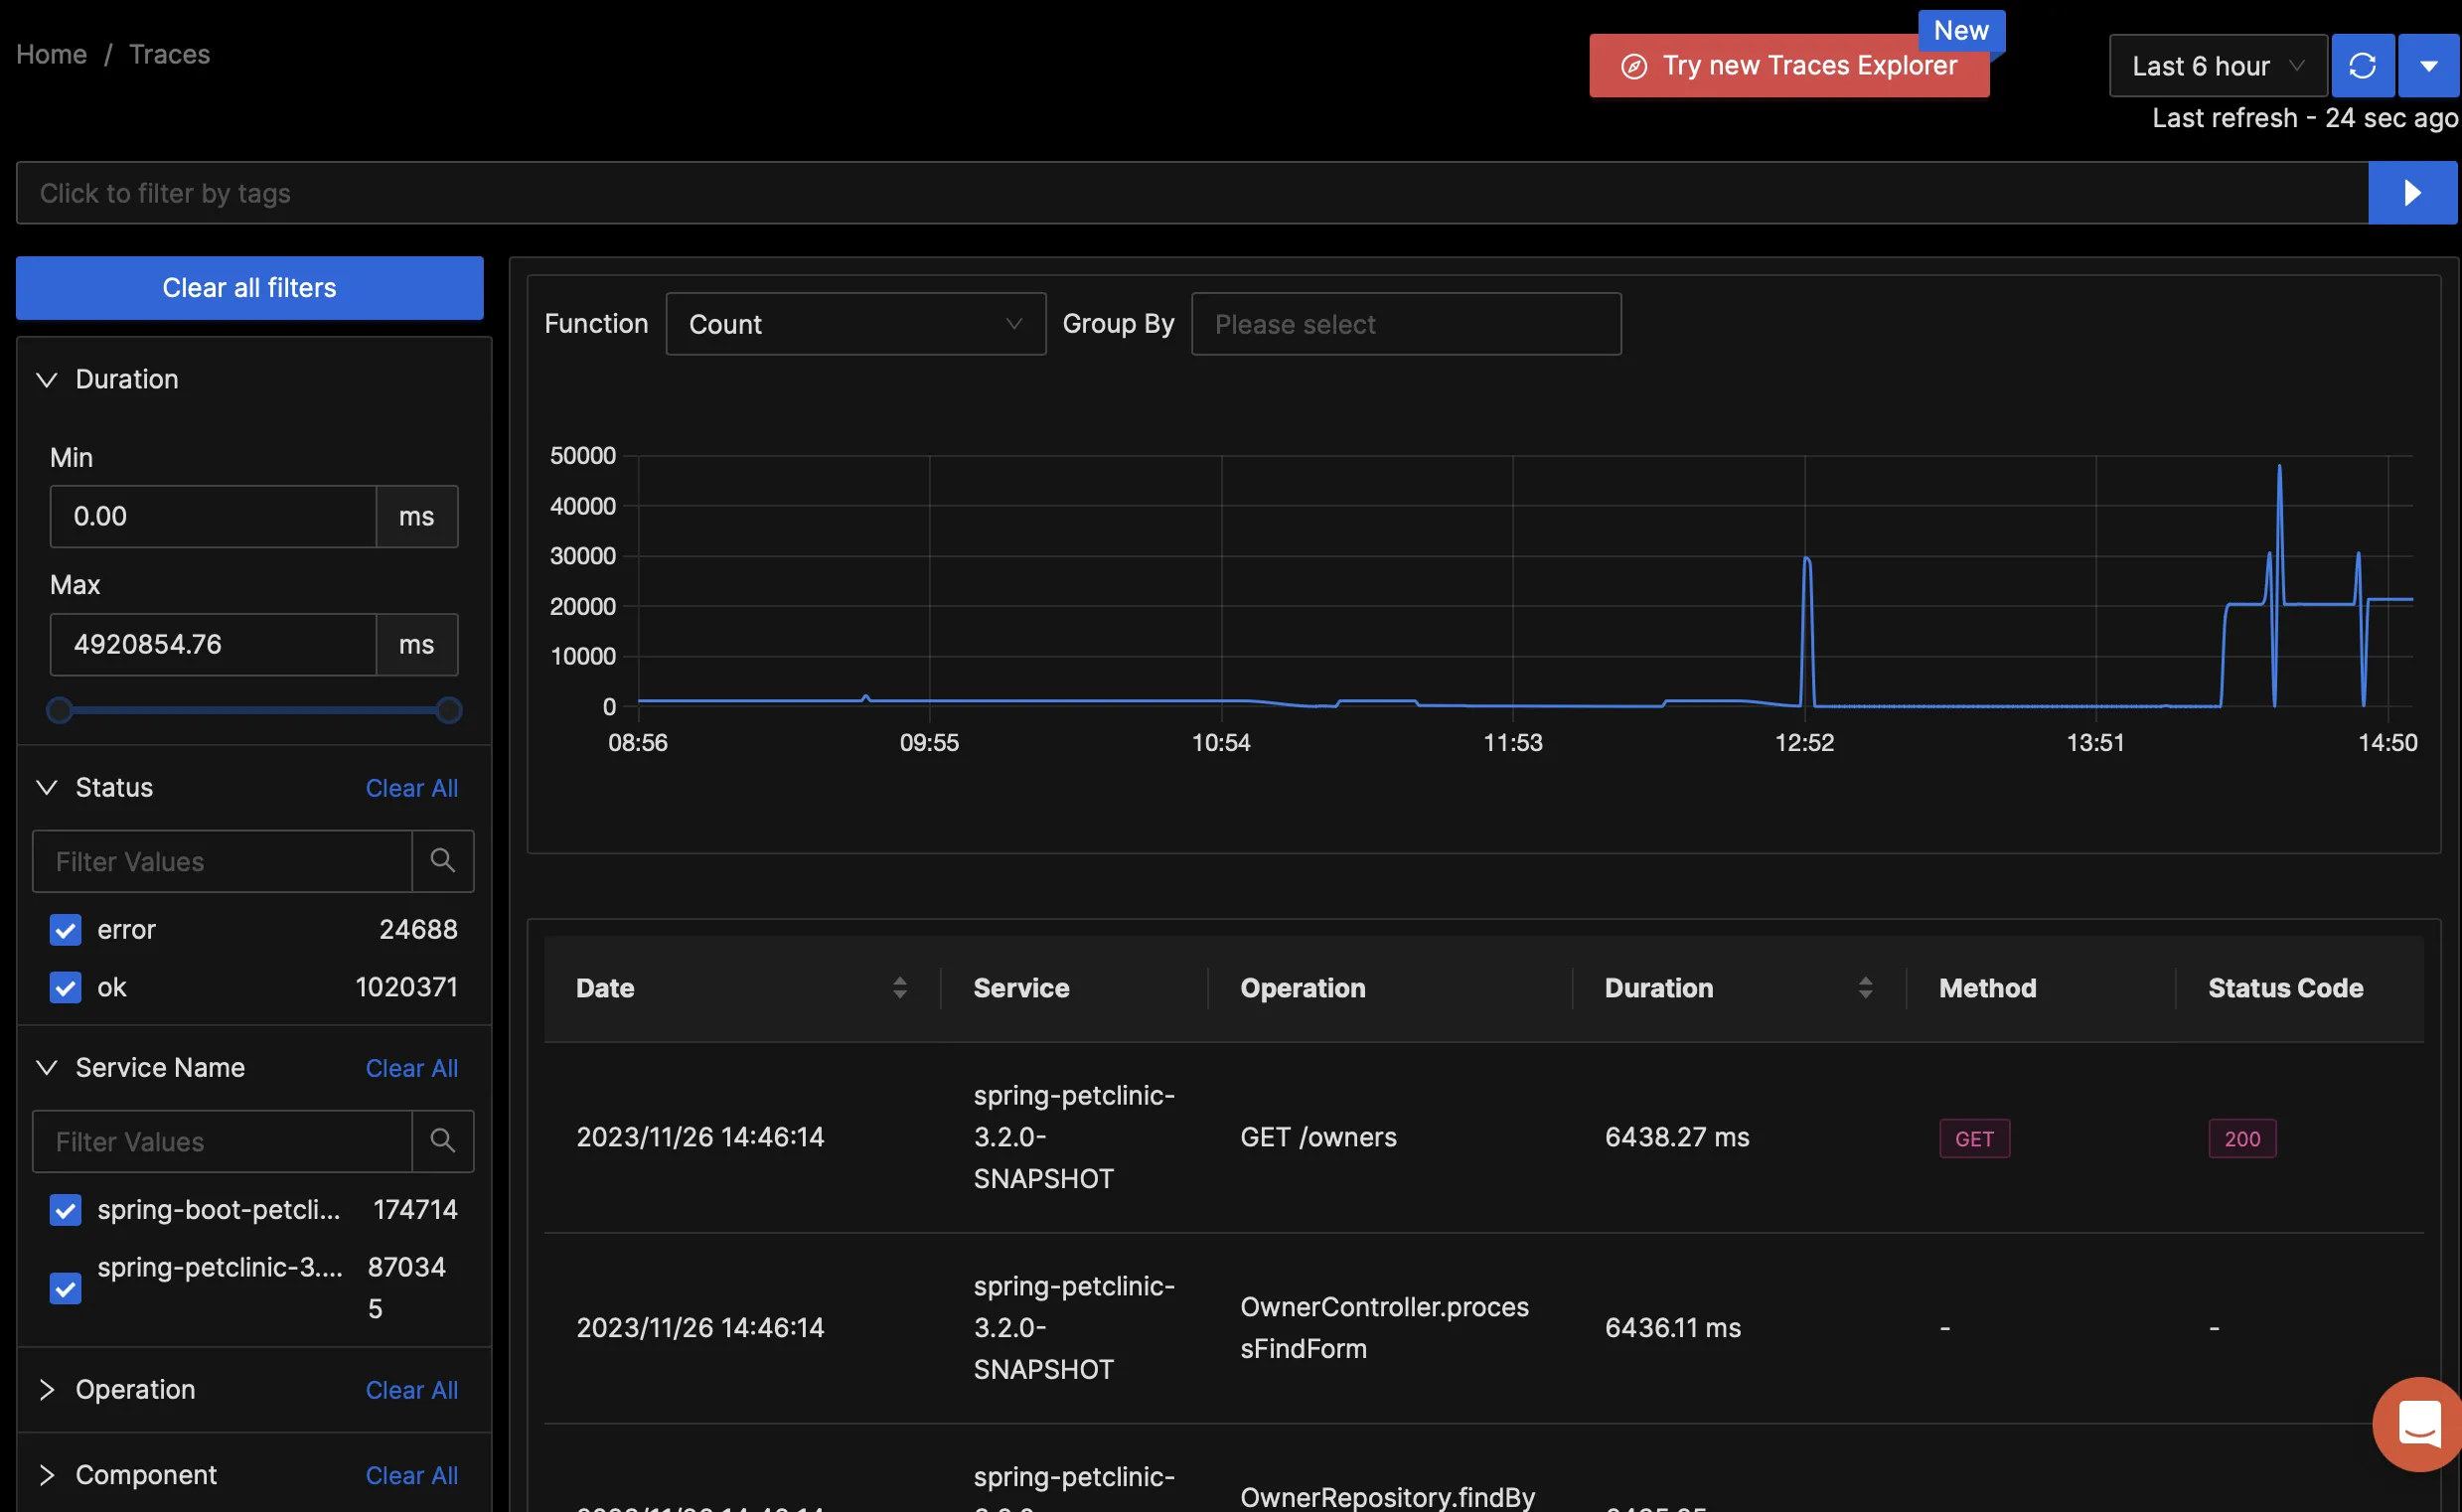
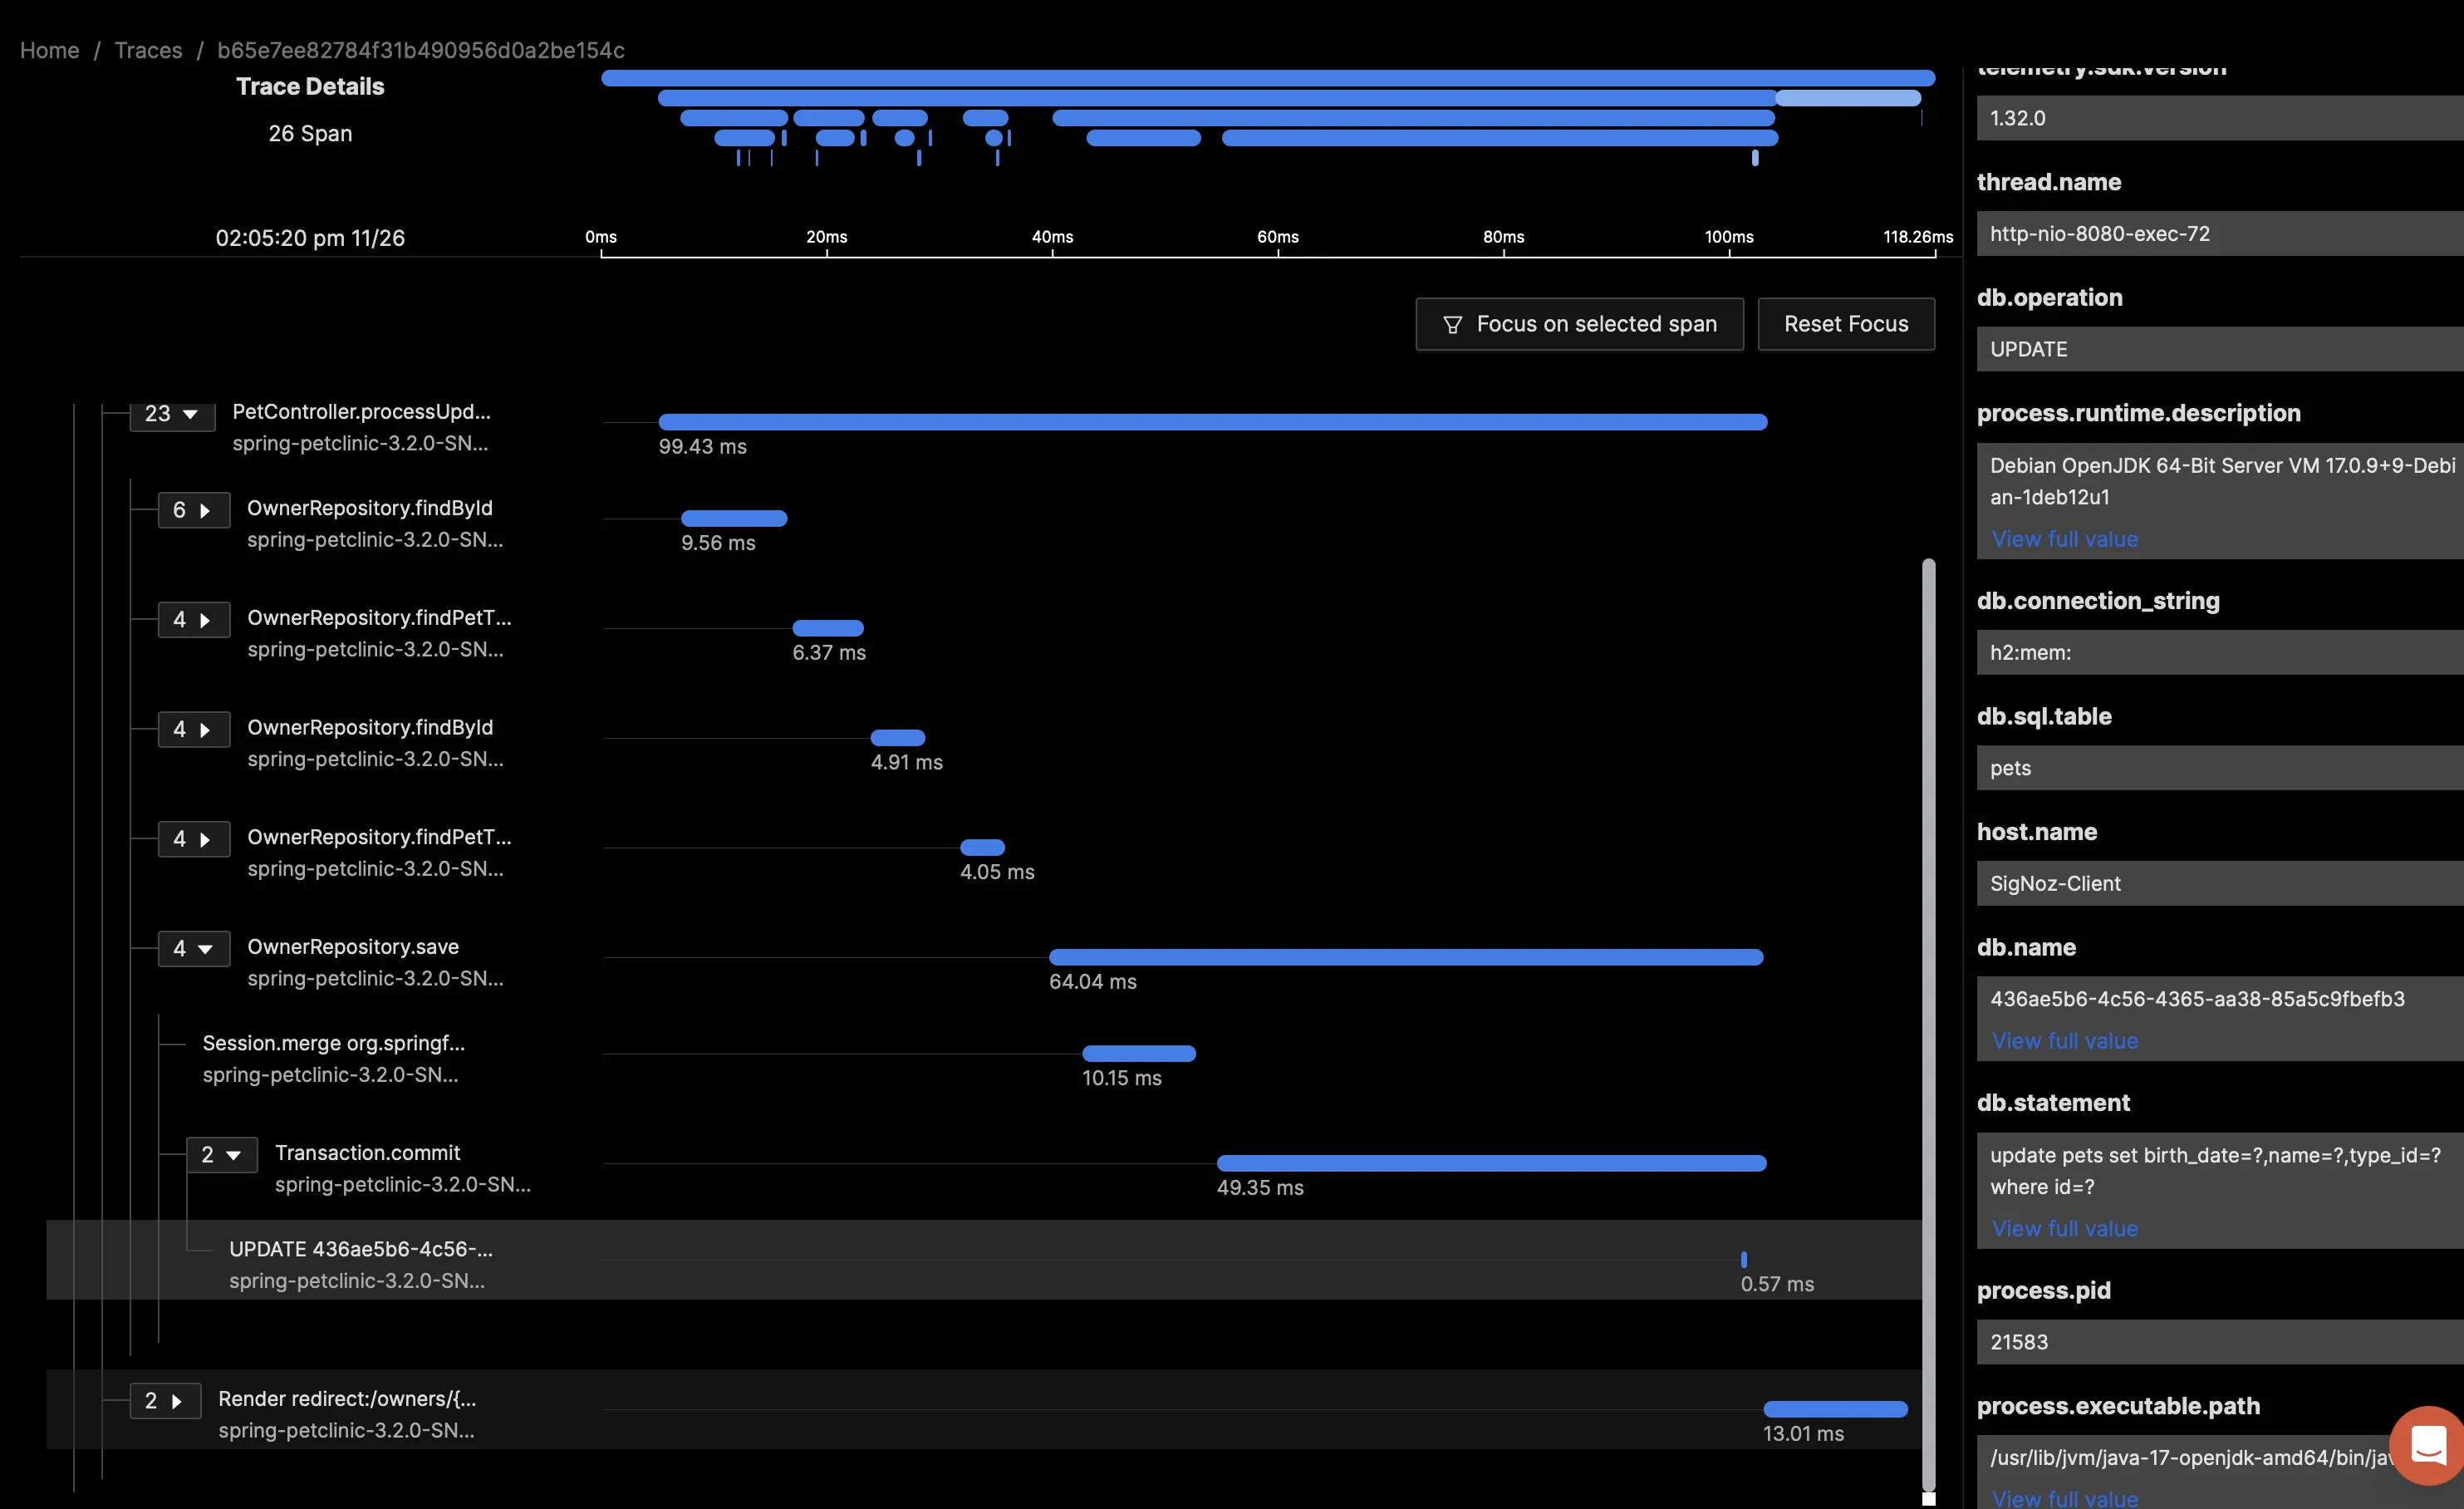
Traces provide a contextual stream of events that have a defined beginning and end. Examples of traces include APM (Application Performance Management) traces (like below) that show an individual end-user transaction with the call stack and contextual attributes such as SQL query text and exception details.
Logs
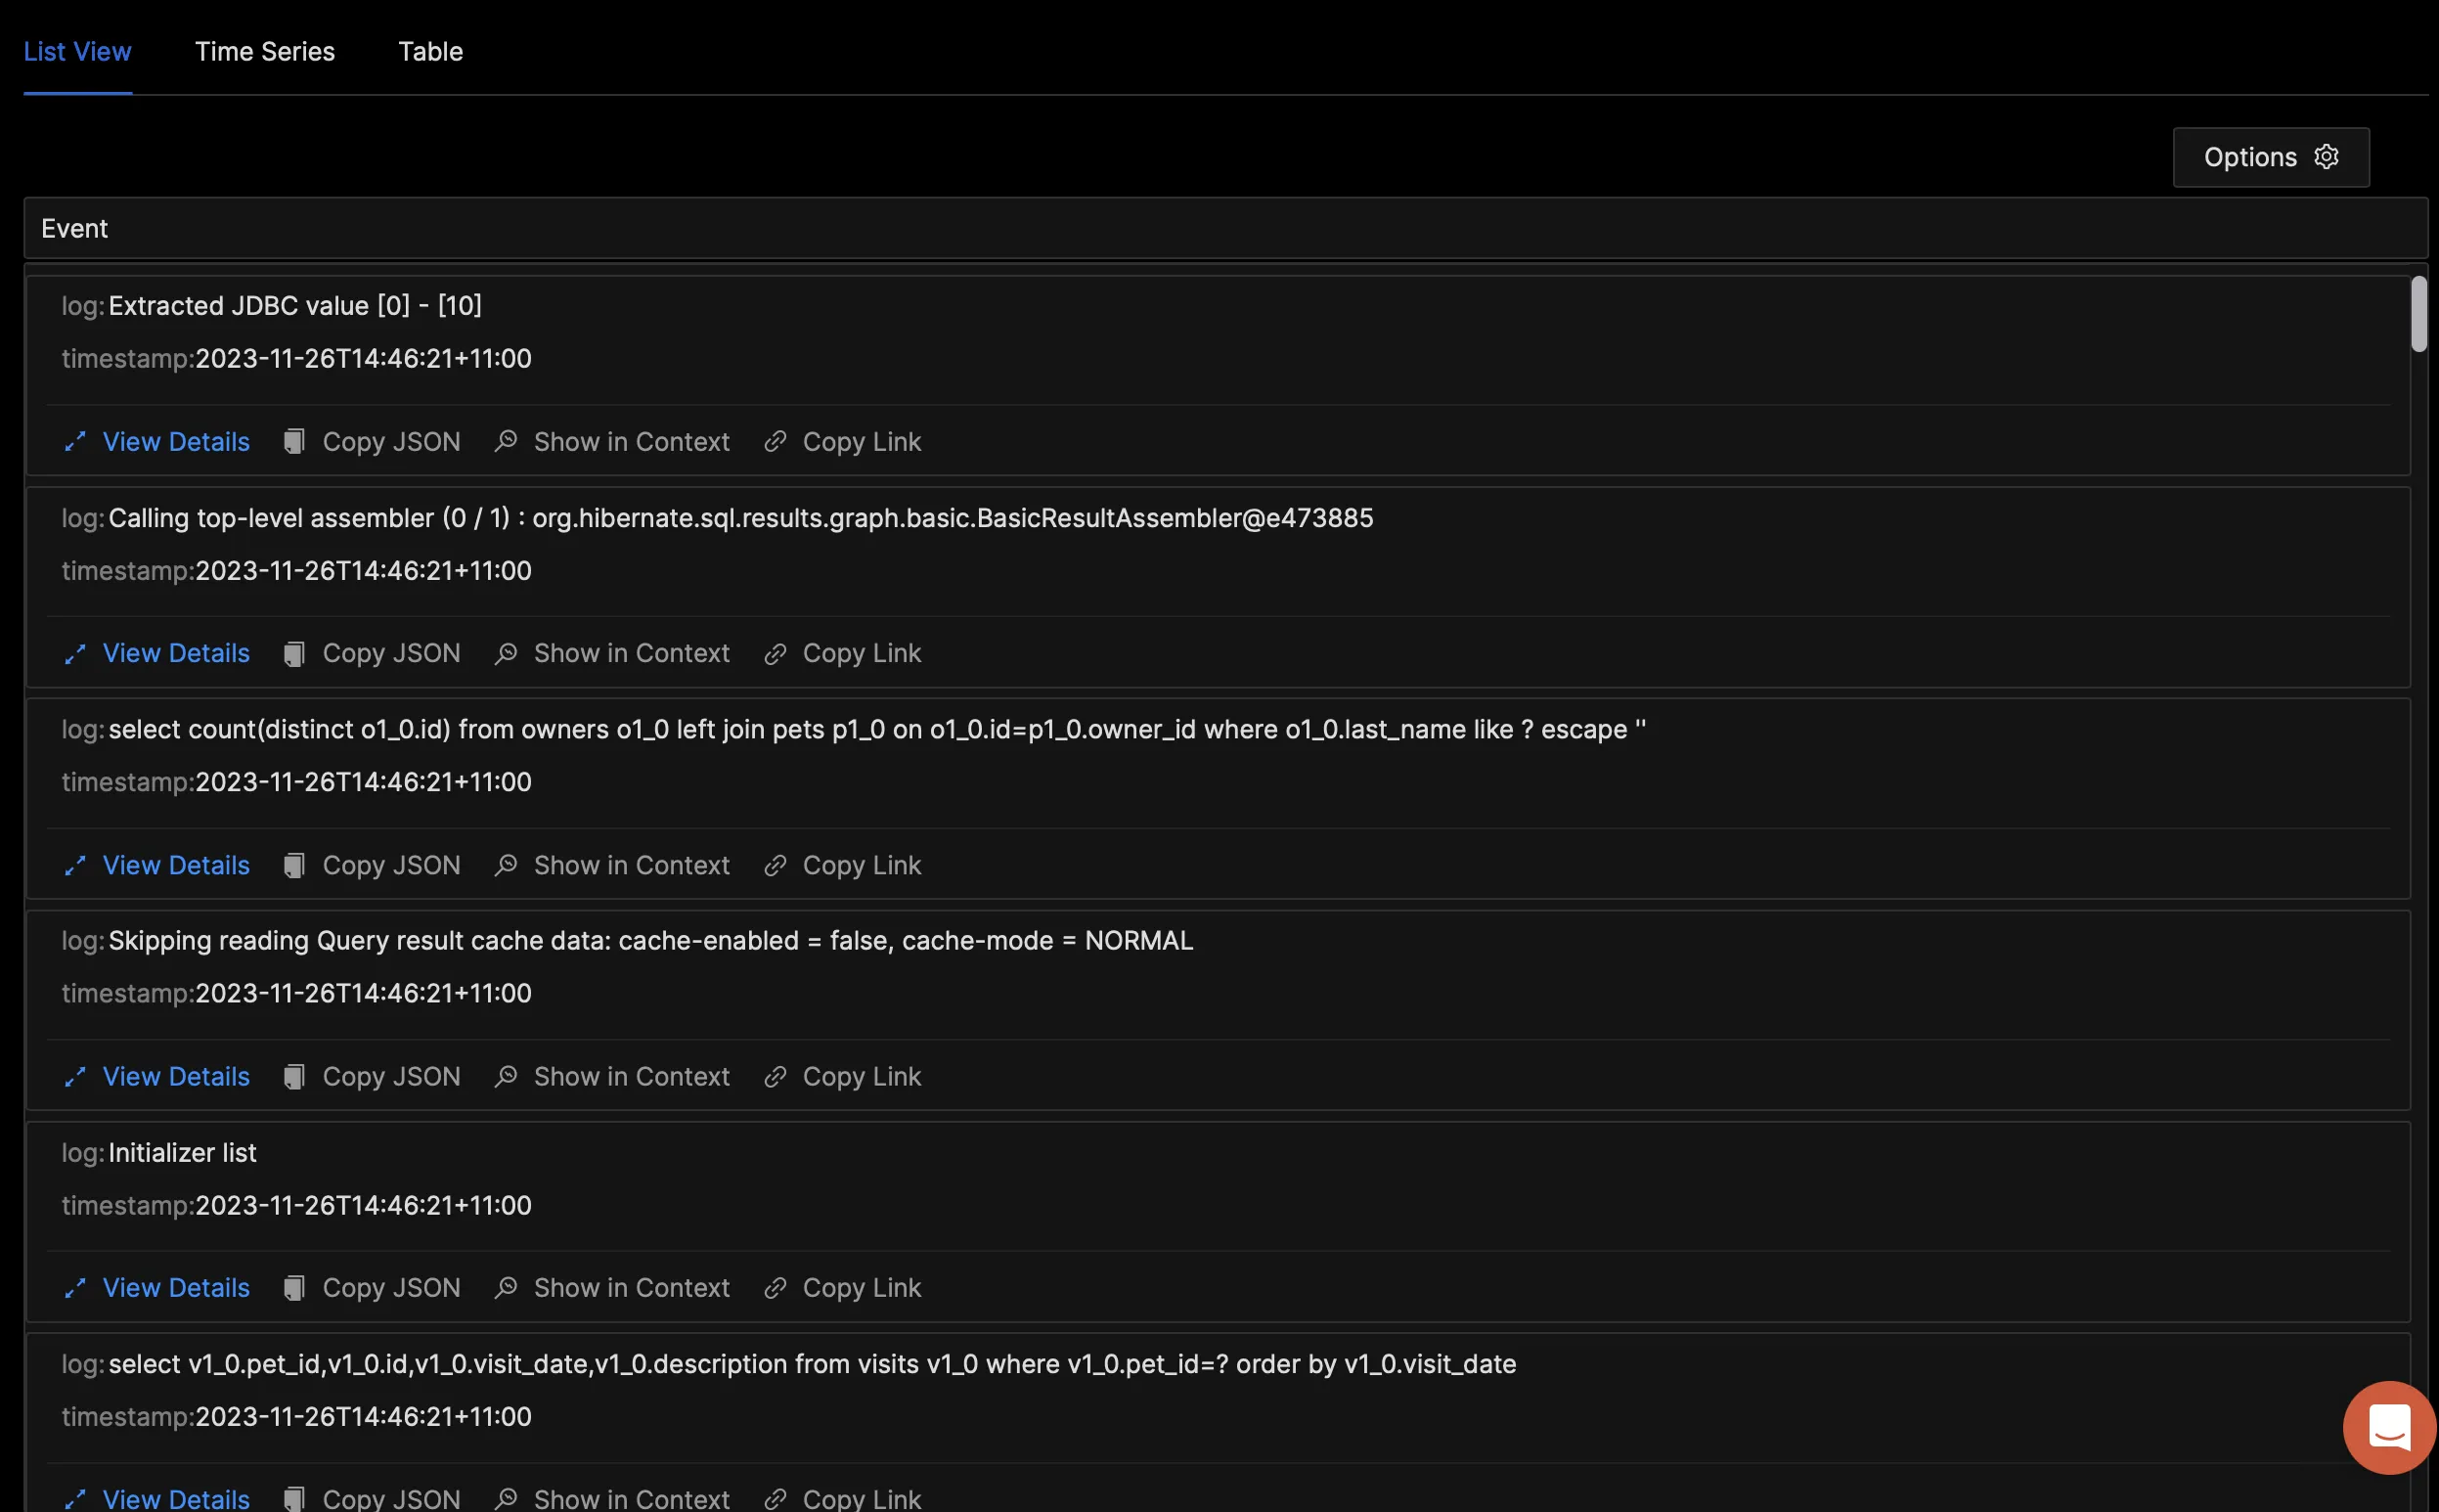
Logs provide a stream of text, typically in an unstructured format, that contains events at a point in time. The logs below have added SPAN and Trace attributes to allow us to associate traces and logs together. See the Logback configuration file in this article on how to achieve this.
Configuring OpenTelemetry for Spring Boot Application
In this section, we will instrument a sample Spring Boot application to send logs, metrics, and traces to SigNoz.
- Download the Pet Clinic sample application
- Setting up SigNoz
- Setting up the OpenTelemetry Collector
- Automatic Instrumentation
- Logback configuration for correlating logs with traces
- Running your application
- Monitoring in SigNoz
Download the Pet Clinic sample application
In this article, I’m going to use the Pet Clinic sample application to demonstrate a Spring Boot application, but these steps can work for any Spring Boot Application.
git clone https://github.com/spring-projects/spring-petclinic.git
Setting up SigNoz
SigNoz cloud is the easiest way to run SigNoz. You can sign up here for a free account and get 30 days of unlimited access to all features.
You can also install and self-host the open-source version of SigNoz yourself. Check out the docs for installing self-host SigNoz.
Setting up the OpenTelemetry Collector
OpenTelemetry Collector is a stand-alone service provided by OpenTelemetry. It can be used as a telemetry-processing system with a lot of flexible configurations to collect and manage telemetry data.
The OpenTelemetry Collector is an agent that resides on the host you want to monitor. While you can send telemetry straight to SigNoz, you will not be able to collect all of the required metrics, including JVM telemetry like Garbage Collection and host metrics (CPU, Memory, Disk).
Step 1 - Downloading OpenTelemetry Collector
Download the appropriate binary package for your Linux or macOS distribution from the OpenTelemetry Collector releases page. We are using the latest version available at the time of writing this tutorial.
In this example, I’m using Debian; however, there are instructions for multiple Linux distributions here. We will be using the otelcol-contrib distribution, which includes some of the latest enhancements to OpenTelemetry that aren’t in the core distribution.
Install Debian otelcol-contrib:
wget https://github.com/open-telemetry/opentelemetry-collector-releases/releases/download/v0.89.0/otelcol-contrib_0.89.0_linux_amd64.deb
sudo dpkg -i otelcol-contrib_0.89.0_linux_amd64.deb
Step 2 - Setting up the Configuration file
We need to edit the config.yaml file to tell the collector what to scrape. In this example, I’ve included pulling of JVM telemetry through Spring Boot Actuator on TCP/8090 and collection of host metrics to ensure we have as much telemetry as possible.
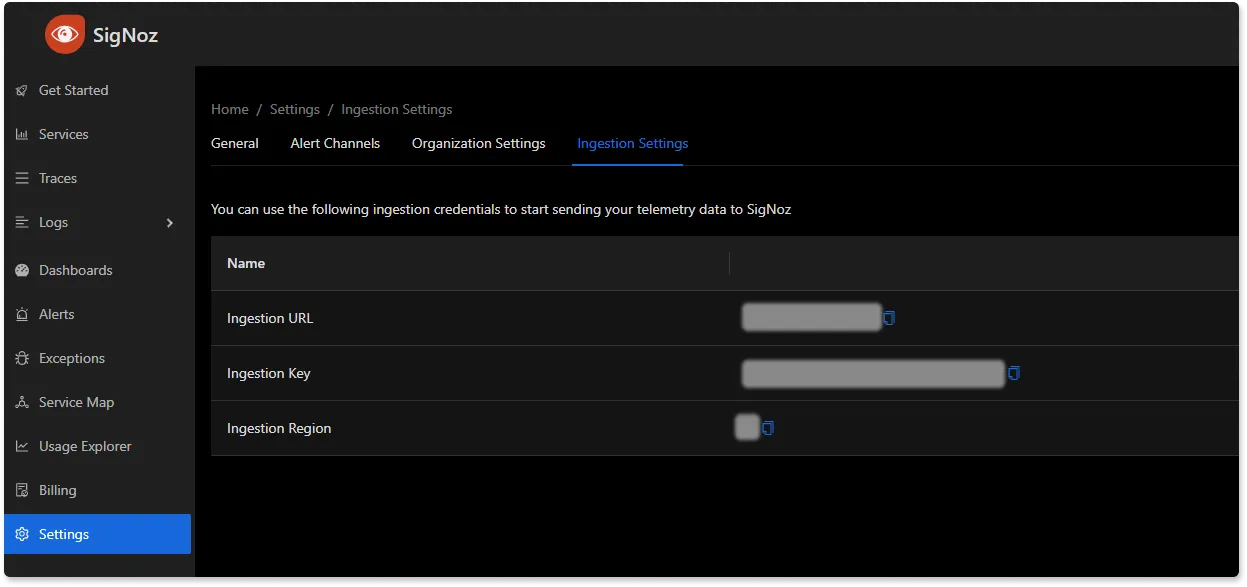
Make sure to add your SigNoz token and correctly configure the region for your cloud account.
receivers:
  otlp:
    protocols:
      grpc:
        endpoint: 0.0.0.0:4317
      http:
        endpoint: 0.0.0.0:4318
  hostmetrics:
    collection_interval: 60s
    scrapers:
      cpu: {}
      disk: {}
      load: {}
      filesystem: {}
      memory: {}
      network: {}
      paging: {}
      process:
        mute_process_name_error: true
        mute_process_exe_error: true
        mute_process_io_error: true
      processes: {}
  prometheus:
    config:
      global:
        scrape_interval: 60s
      scrape_configs:
        - job_name: otel-collector-binary
          scrape_interval: 60s
          static_configs:
            - targets: ["localhost:8889>"]
        - job_name: "jvm-metrics"
          scrape_interval: 10s
          metrics_path: "/actuator/prometheus"
          static_configs:
            - targets: ["localhost:8090>"]
processors:
  batch:
    send_batch_size: 1000
    timeout: 10s
  # Ref: https://github.com/open-telemetry/opentelemetry-collector-contrib/blob/main/processor/resourcedetectionprocessor/README.md
  resourcedetection:
    detectors: [env, system] # Before system detector, include ec2 for AWS, gcp for GCP and azure for Azure.
    # Using OTEL_RESOURCE_ATTRIBUTES envvar, env detector adds custom labels.
    timeout: 2s
    system:
      hostname_sources: [os] # alternatively, use [dns,os] for setting FQDN as host.name and os as fallback
extensions:
  health_check: {}
  zpages: {}
exporters:
  otlp:
    endpoint: "ingest.{region}.signoz.cloud:443"
    tls:
      insecure: false
    headers:
      "signoz-ingestion-key": <SIGNOZ_ACCESS_TOKEN>
  logging:
    verbosity: normal
service:
  telemetry:
    metrics:
      address: 0.0.0.0:8888
  extensions: [health_check, zpages]
  pipelines:
    metrics:
      receivers: [otlp]
      processors: [batch]
      exporters: [otlp]
    metrics/internal:
      receivers: [prometheus, hostmetrics]
      processors: [resourcedetection, batch]
      exporters: [otlp]
    traces:
      receivers: [otlp]
      processors: [batch]
      exporters: [otlp]
    logs:
      receivers: [otlp]
      processors: [batch]
      exporters: [otlp]
You can find your access token and region under the settings tab of SigNoz:
Step 3 - Restart the collector:
The collector must be restarted for the settings to take effect.
leigh@SigNoz-Client:~$ sudo systemctl restart otelcol-contrib
Configuring for Traces and Logs
Automatic Instrumentation:
Automatic instrumentation is the easiest way to get started as it requires zero code changes and only minor tweaks to configuration files for instrumentation to take effect.
Configuring Maven:
Maven is a build system for Spring Boot (Gradle can also be used) and handles the packaging and dependencies for your application code. Add the following lines to the dependencies section of pom.xml to enable logback logging and expose Prometheus metrics.
  	<!-- Spring and Spring Boot dependencies -->
    <dependency>
            <groupId>org.springframework.boot</groupId>
            <artifactId>spring-boot-starter-actuator</artifactId>
    </dependency>
    <dependency>
            <groupId>io.micrometer</groupId>
            <artifactId>micrometer-registry-prometheus</artifactId>
            <scope>runtime</scope>
    </dependency>
    <dependency>
            <groupId>io.opentelemetry.instrumentation</groupId>
            <artifactId>opentelemetry-logback-1.0</artifactId>
            <version>1.9.2-alpha</version>
            <scope>runtime</scope>
    </dependency>
Logback configuration for correlating logs with traces:
We need to create a new Logback configuration file to tell Logback to add the Trace and SPAN attributes to log lines so that SigNoz can correlate logs and traces.

Create the logback configuration file src/main/resources/logback.xml:
<?xml version="1.0" encoding="UTF-8" ?>
<configuration>
    <appender name="STDOUT" class="ch.qos.logback.core.ConsoleAppender">
        <encoder>
            <pattern><![CDATA[%date{HH:mm:ss.SSS} [%thread] %-5level %logger{15}#%line %X{req.requestURI} traceId: %X{trace_id} spanId: %X{span_id} %msg\n]]></pattern>
        </encoder>
    </appender>

    <appender name="OTEL" class="io.opentelemetry.instrumentation.logback.v1_0.OpenTelemetryAppender">
        <appender-ref ref="STDOUT" />
    </appender>

    <root>
        <level value="DEBUG" />
        <appender-ref ref="STDOUT" />
    </root>

</configuration>
Running your application
Package your application:
Use Maven to Package your application as a JAR file. Packaging the application allows us to easily export and execute the application without worrying about dependencies.
./mvnw package
Example:
leigh@SigNoz-Client:~/spring-petclinic$ ./mvnw package
...
# Lines skipped for brevity
...
[INFO] --- spring-boot:3.2.0:repackage (repackage) @ spring-petclinic ---
[INFO] Replacing main artifact /home/leigh/spring-petclinic/target/spring-petclinic-3.2.0-SNAPSHOT.jar with repackaged archive, adding nested dependencies in BOOT-INF/.
[INFO] The original artifact has been renamed to /home/leigh/spring-petclinic/target/spring-petclinic-3.2.0-SNAPSHOT.jar.original
[INFO] ------------------------------------------------------------------------
[INFO] BUILD SUCCESS
[INFO] ------------------------------------------------------------------------
[INFO] Total time:  28.365 s
[INFO] Finished at: 2023-11-26T15:49:33+11:00
[INFO] ------------------------------------------------------------------------
leigh@SigNoz-Client:~/spring-petclinic$
Download the OpenTelemetry Java Agent:
The OpenTelemetry Java Agent is a code profiler that allows us to get the method-level code execution details and provides the traces for the OpenTelemetry collector to send upstream for analysis by SigNoz. We can download the java agent for the Otel website using wget. I like to put the agent in the /opt directory for shared use.
wget https://github.com/open-telemetry/opentelemetry-java-instrumentation/releases/latest/download/opentelemetry-javaagent.jar
In order to start our Spring boot application, we will need to set some environment variables to tell the application where to send our signals (telemetry) and where our OTEL collector and agent libraries are located.
OTEL_LOGS_EXPORTER=otlp OTEL_RESOURCE_ATTRIBUTES=service.name=name OTEL_EXPORTER_OTLP_ENDPOINT="http://<IP of the OTEL collector or SigNoz>:4317" java -javaagent:agent_path -jar path_to_target
| Option | Description | Example Values |
|---|---|---|
| OTEL_LOGS_EXPORTER | Tells the java agent which protocol to use for logs. | otlp |
| OTEL_RESOURCE_ATTRIBUTES | Tells the java agent about any resource attributes such as the service name. | service.name=spring-boot-petclinic |
| OTEL_EXPORTER_OTLP_ENDPOINT | Tells the agent where to send OTLP export such as a collector on http://localhost, or directly to your SigNoz instance. | localhost:4317 |
| javaagent | Where the java agent library is located. | opentelemetry-javaagent.jar |
| jar | Which Jar file to load | spring-petclinic/target/spring-petclinic-3.2.0-SNAPSHOT.jar |
Here is the example I used in the pet clinic example for this article.
OTEL_LOGS_EXPORTER=otlp OTEL_RESOURCE_ATTRIBUTES=service.name=spring-boot-petclinic OTEL_EXPORTER_OTLP_ENDPOINT="http://localhost:4317" java -javaagent:/opt/opentelemetry-javaagent.jar -jar /home/leigh/spring-petclinic/target/spring-petclinic-3.2.0-SNAPSHOT.jar
Monitoring with SigNoz
Step 1 - Generate Load:
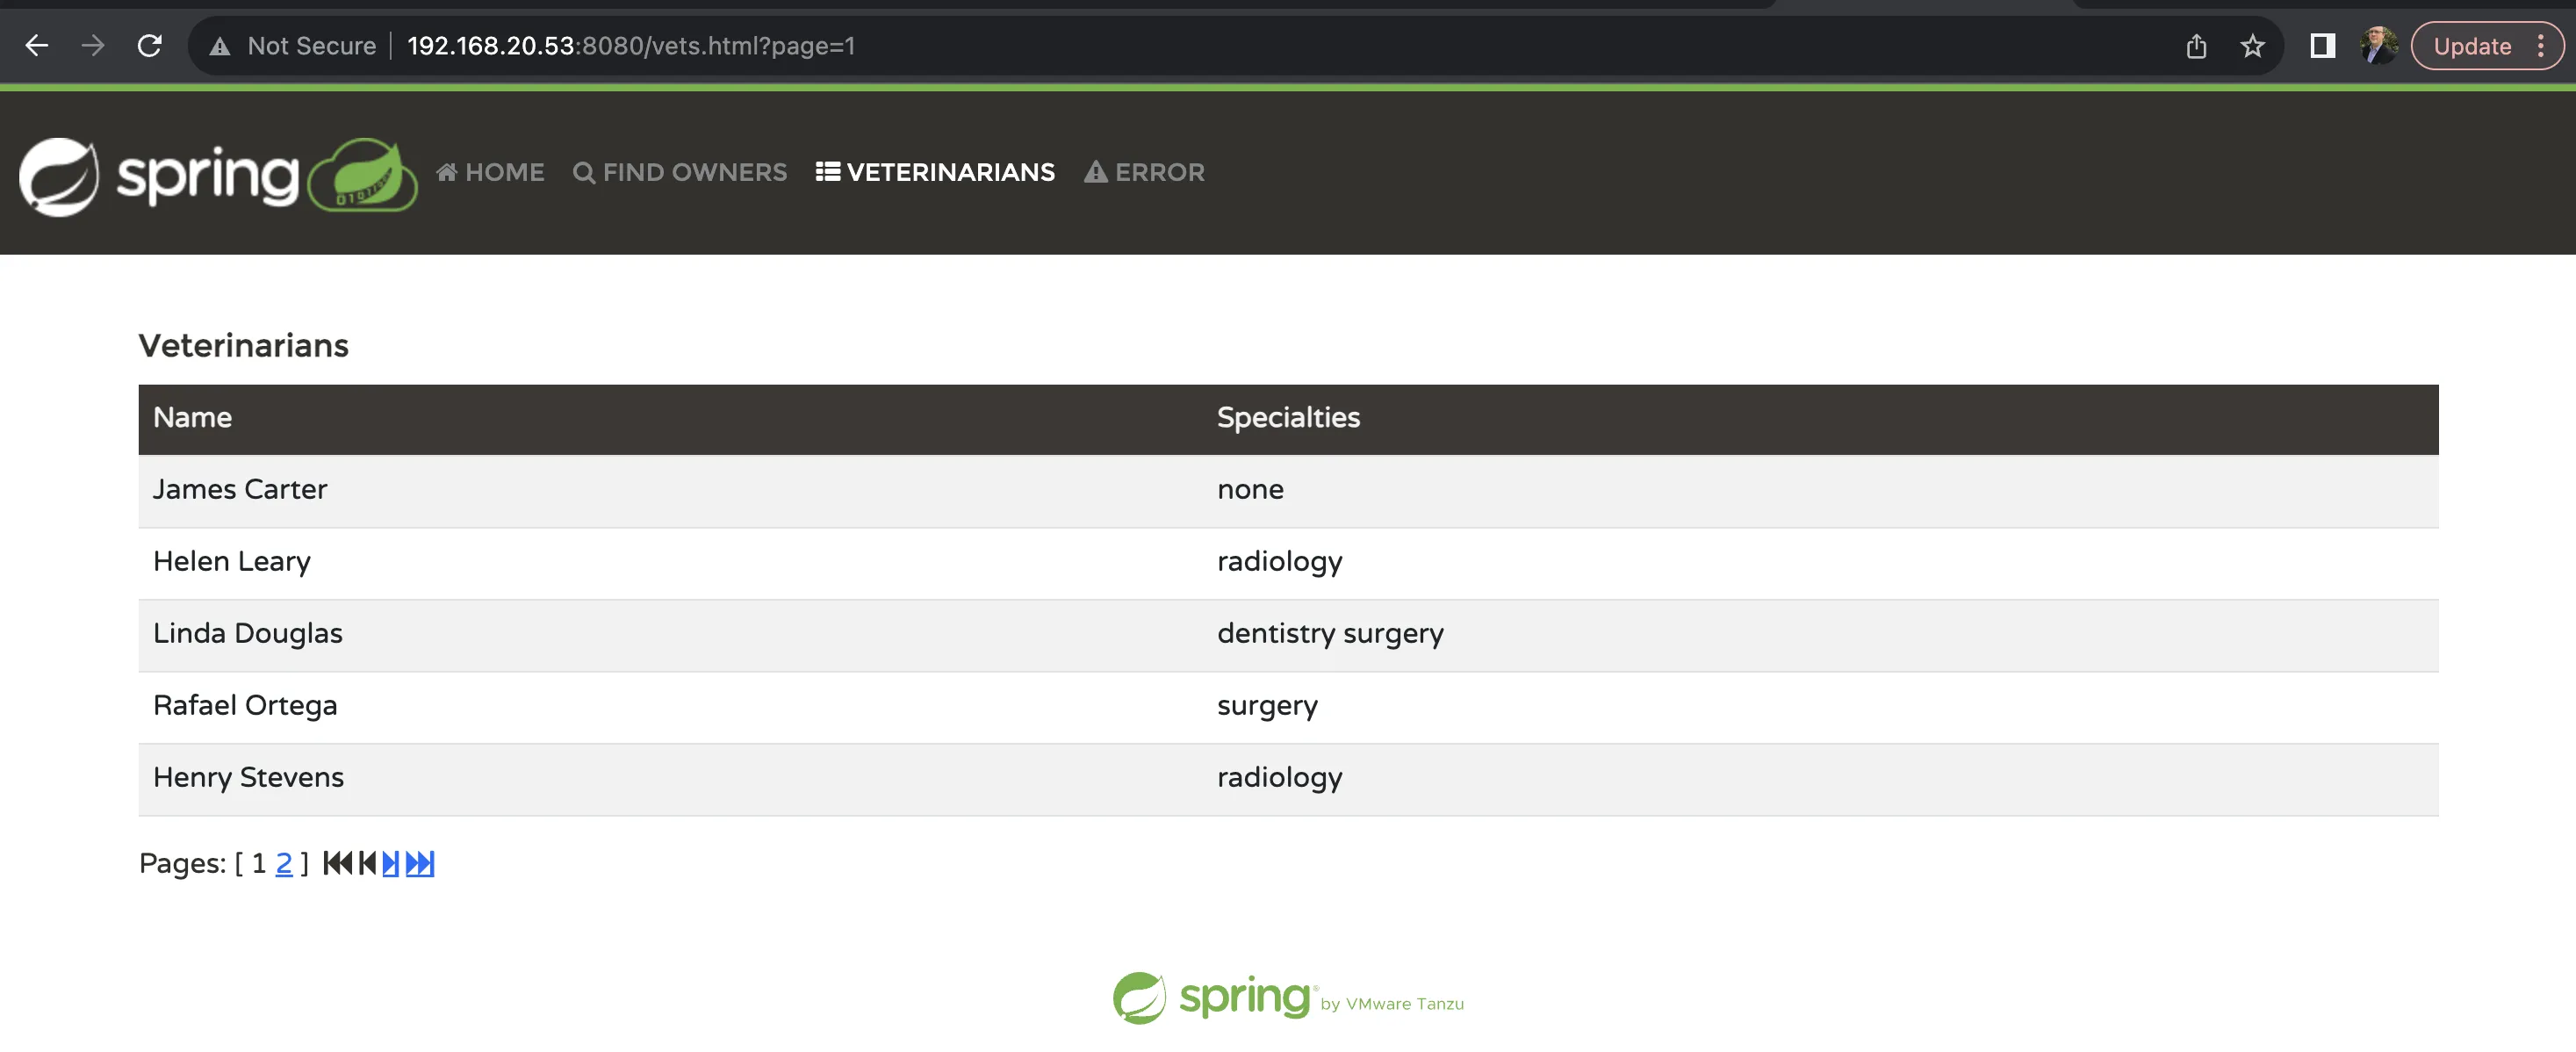
Traces are created when the application is accessed. Therefore, we need to generate some load on the application using either automated tools like Apache Bench, or by using a browser to access the application. The default port for Spring Boot is TCP/8080.
Step 2 - View services in SigNoz
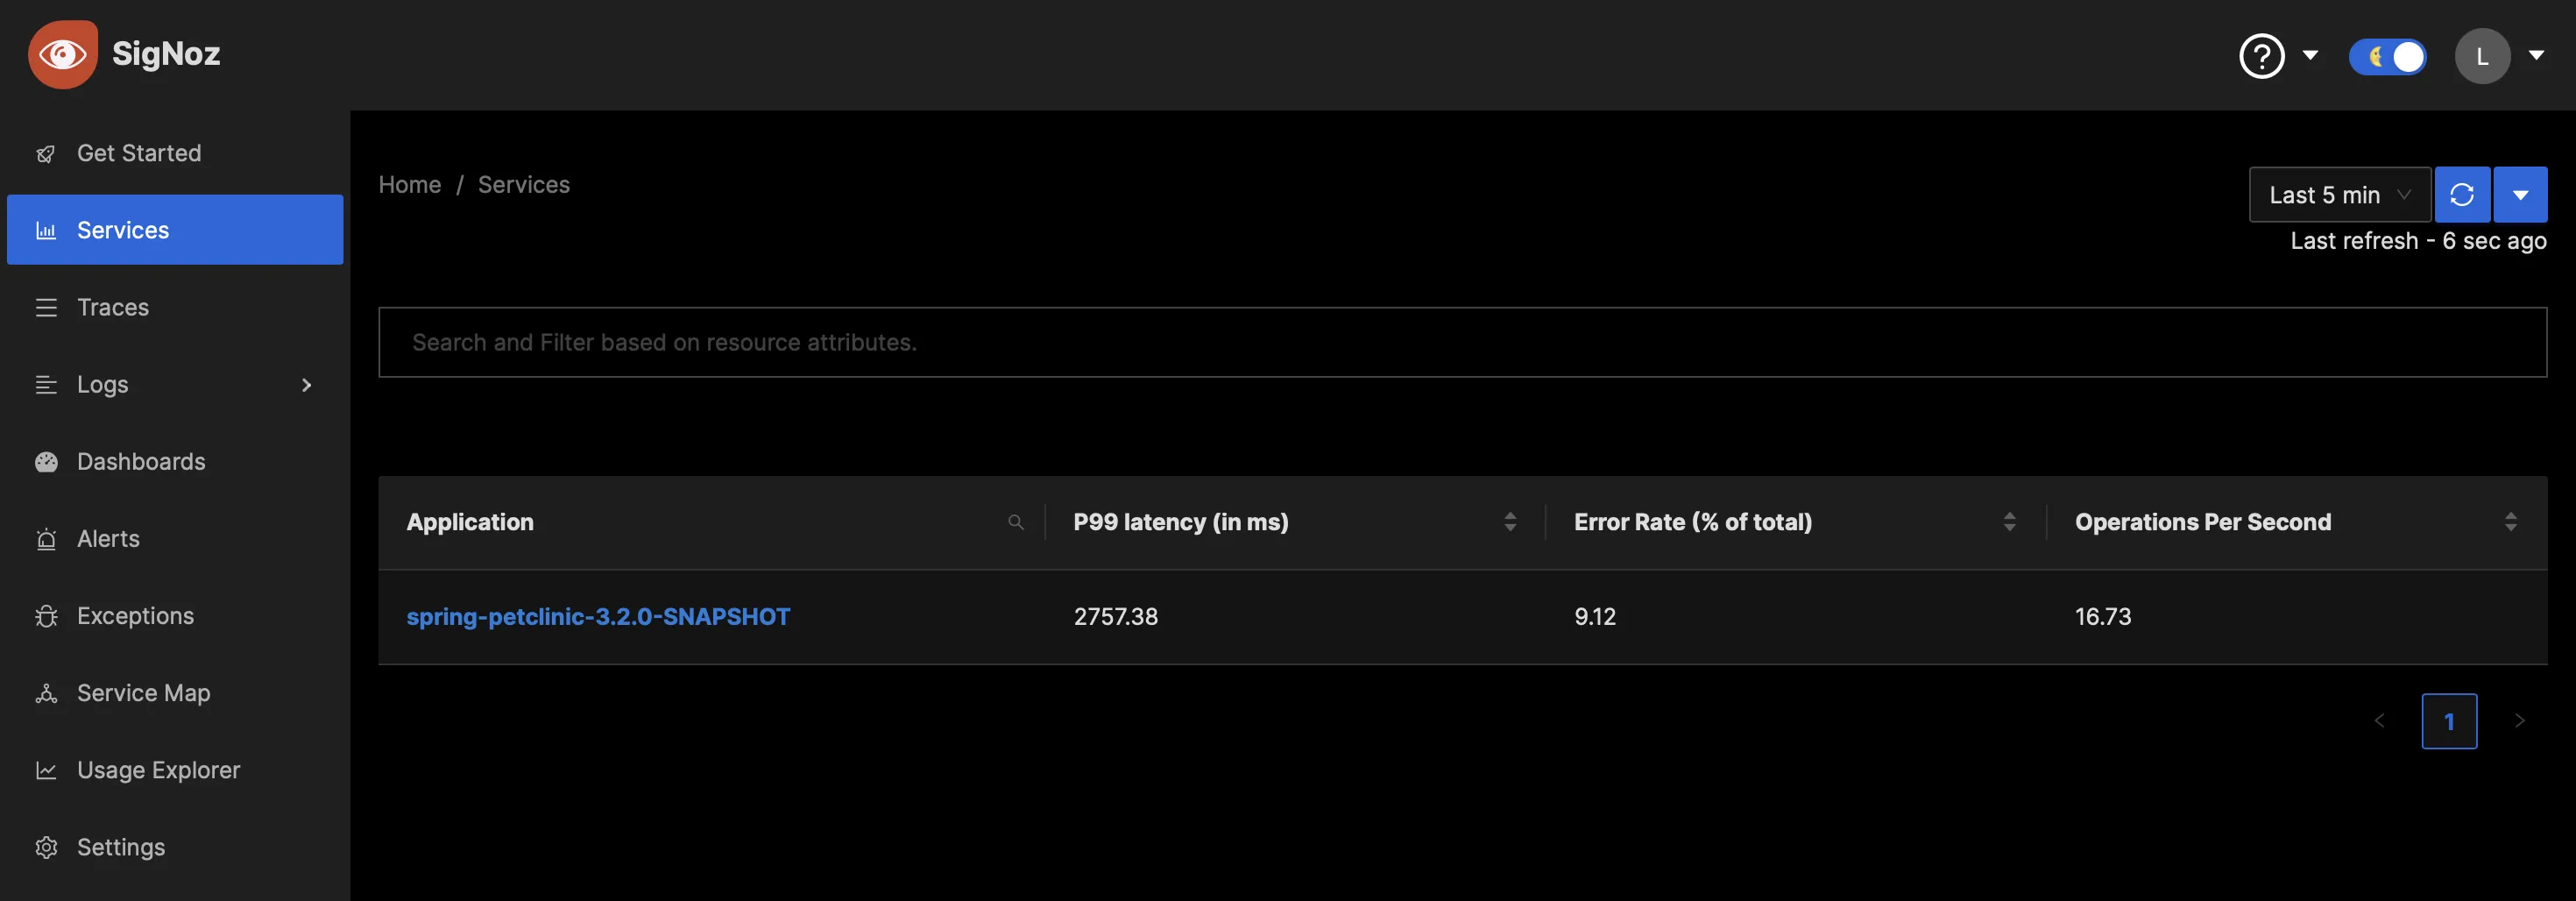
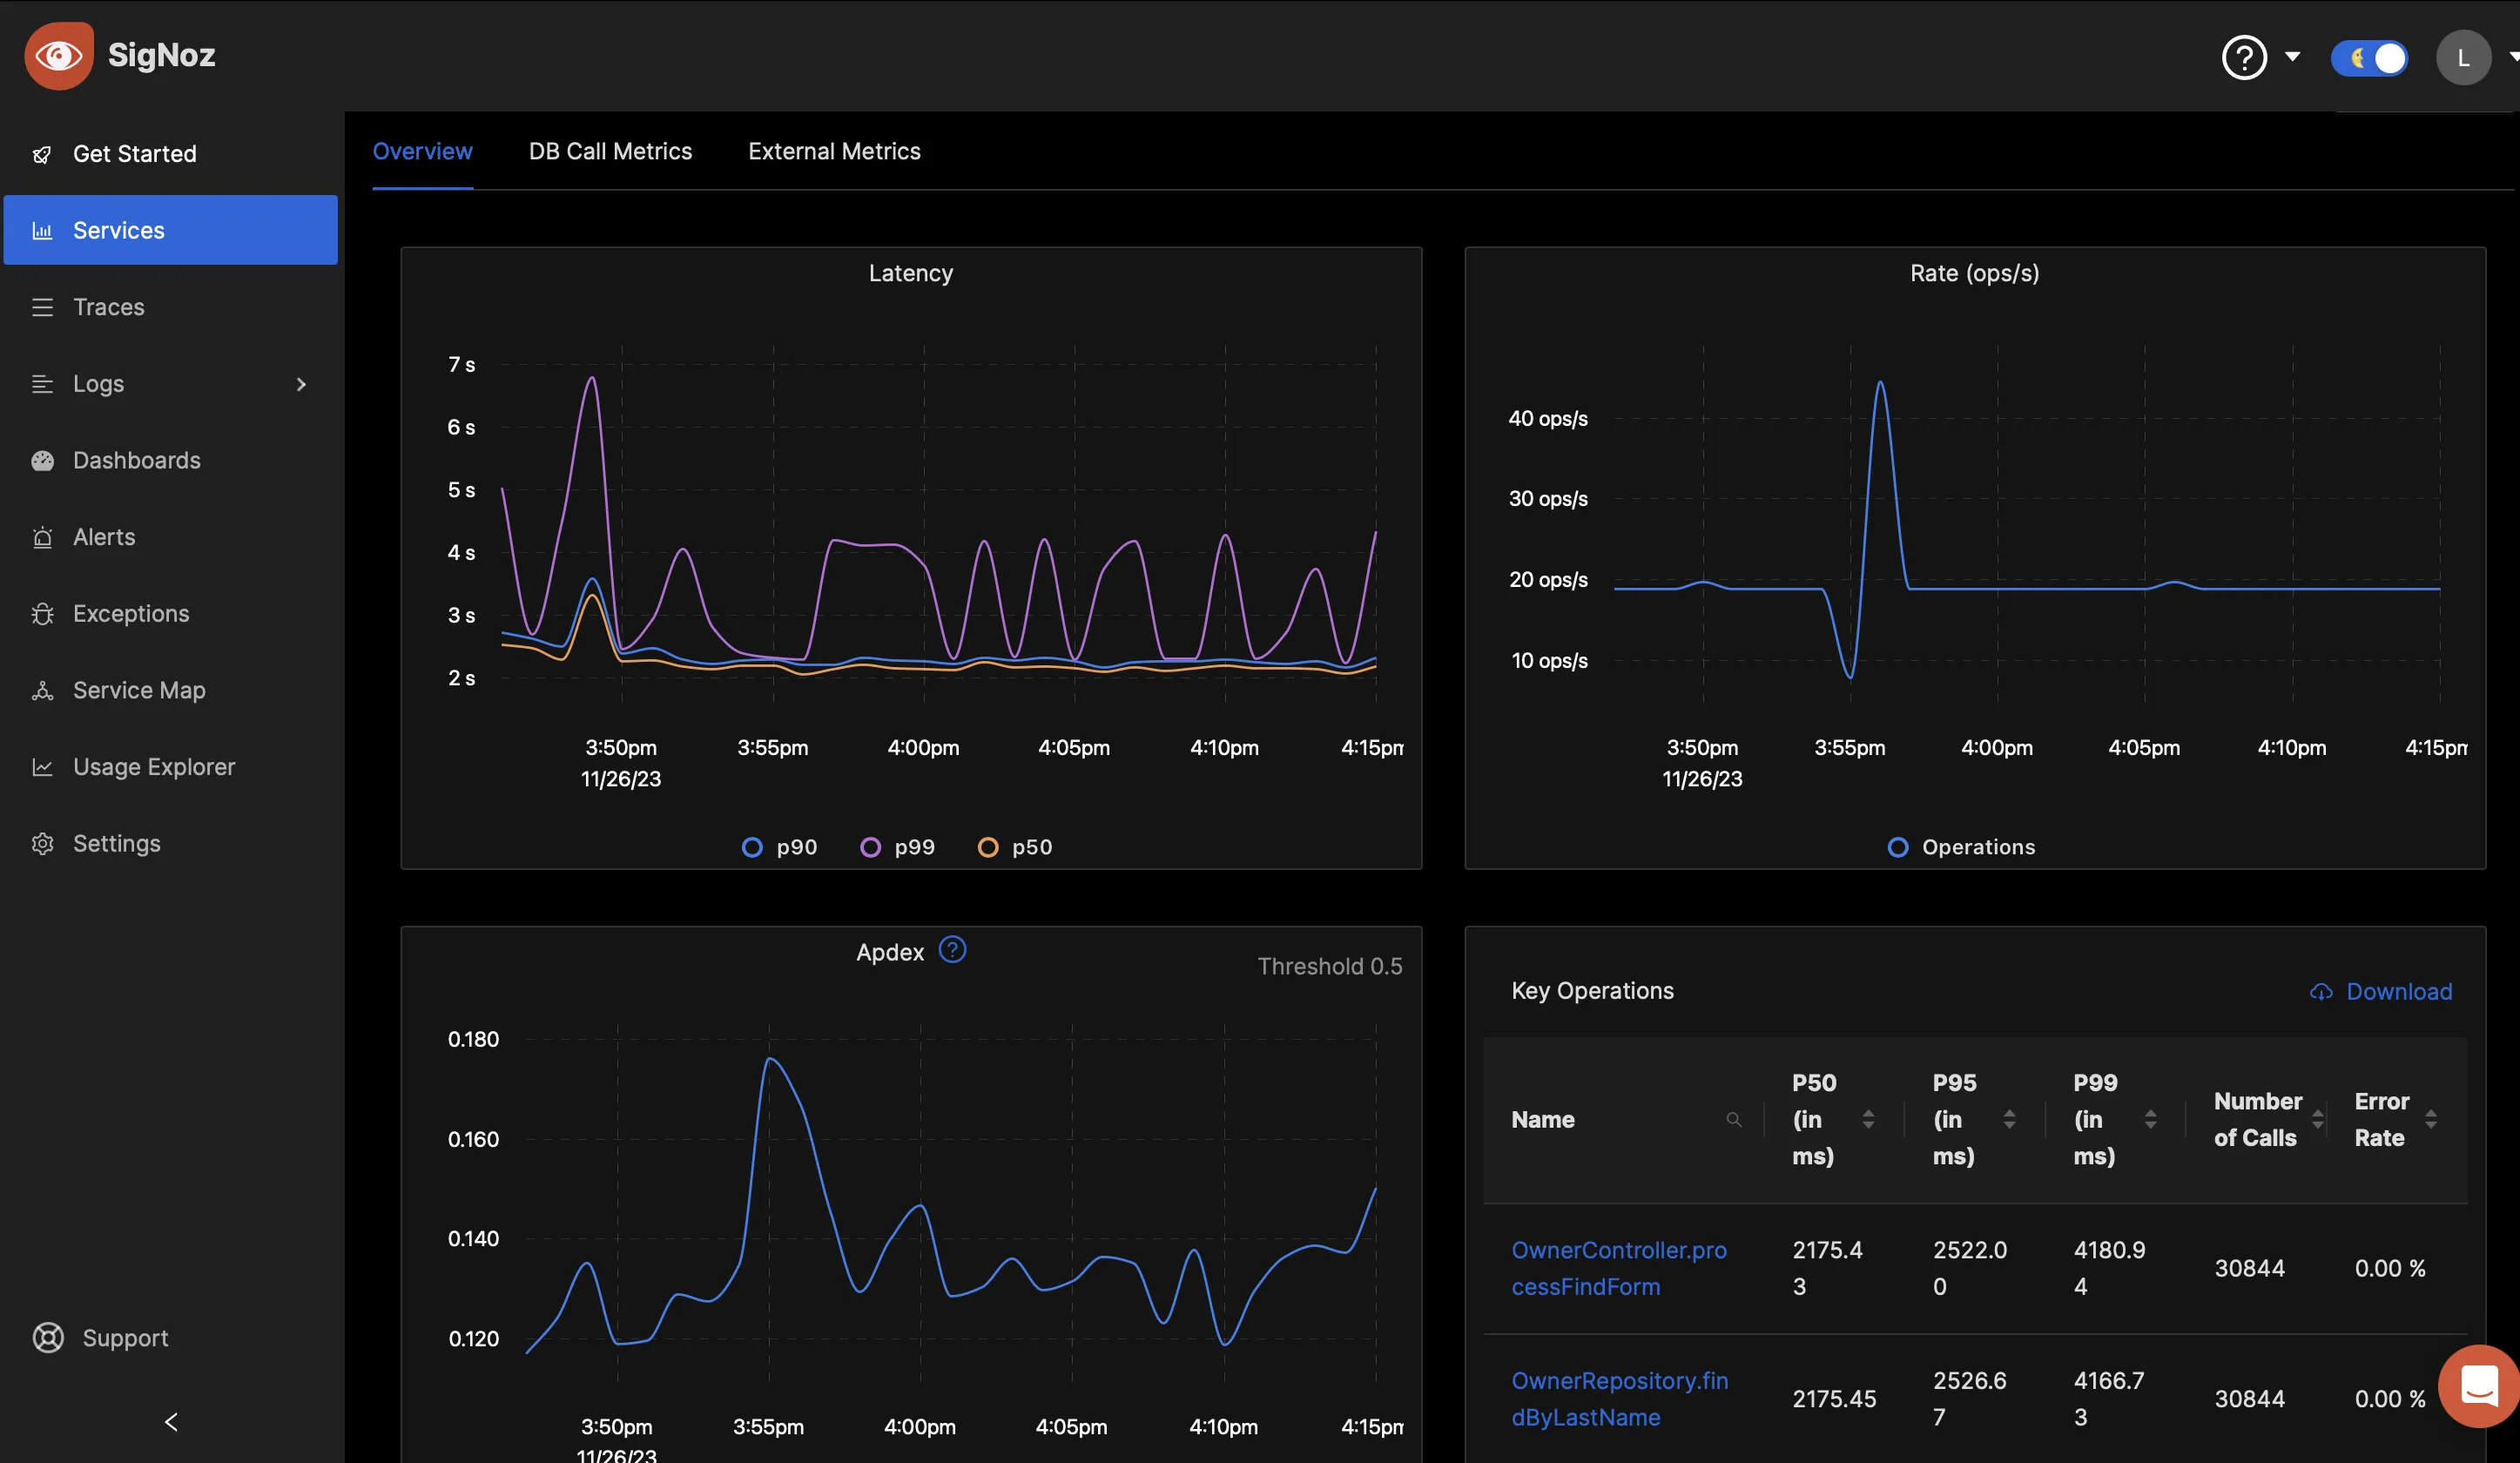
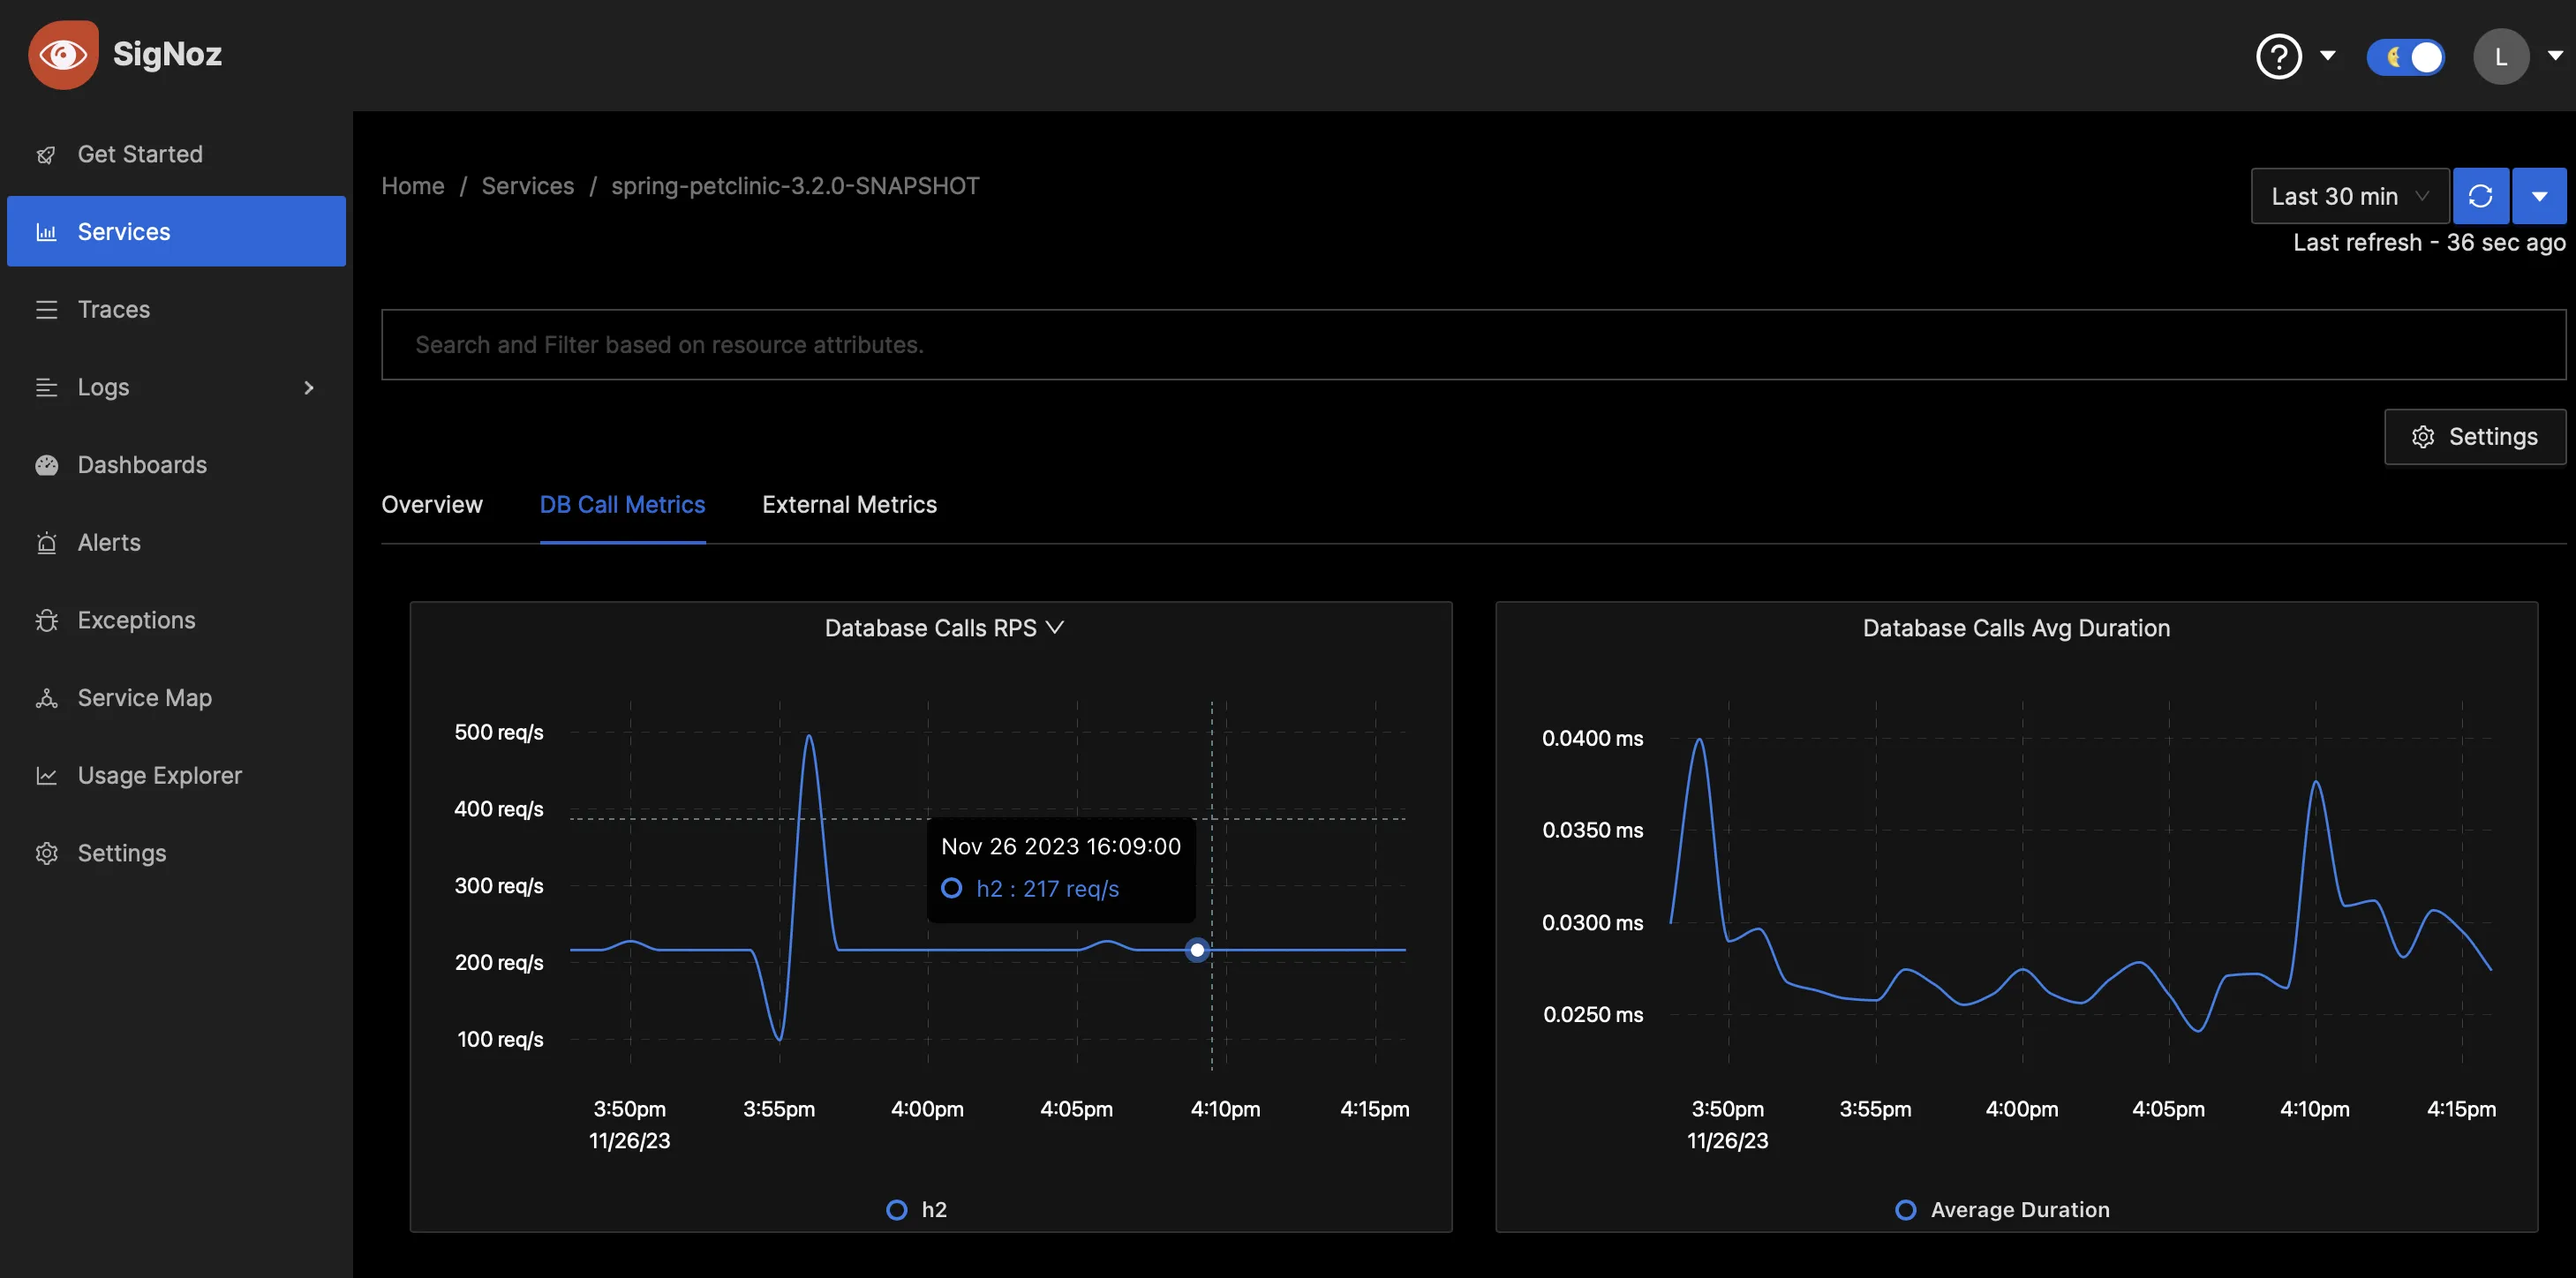
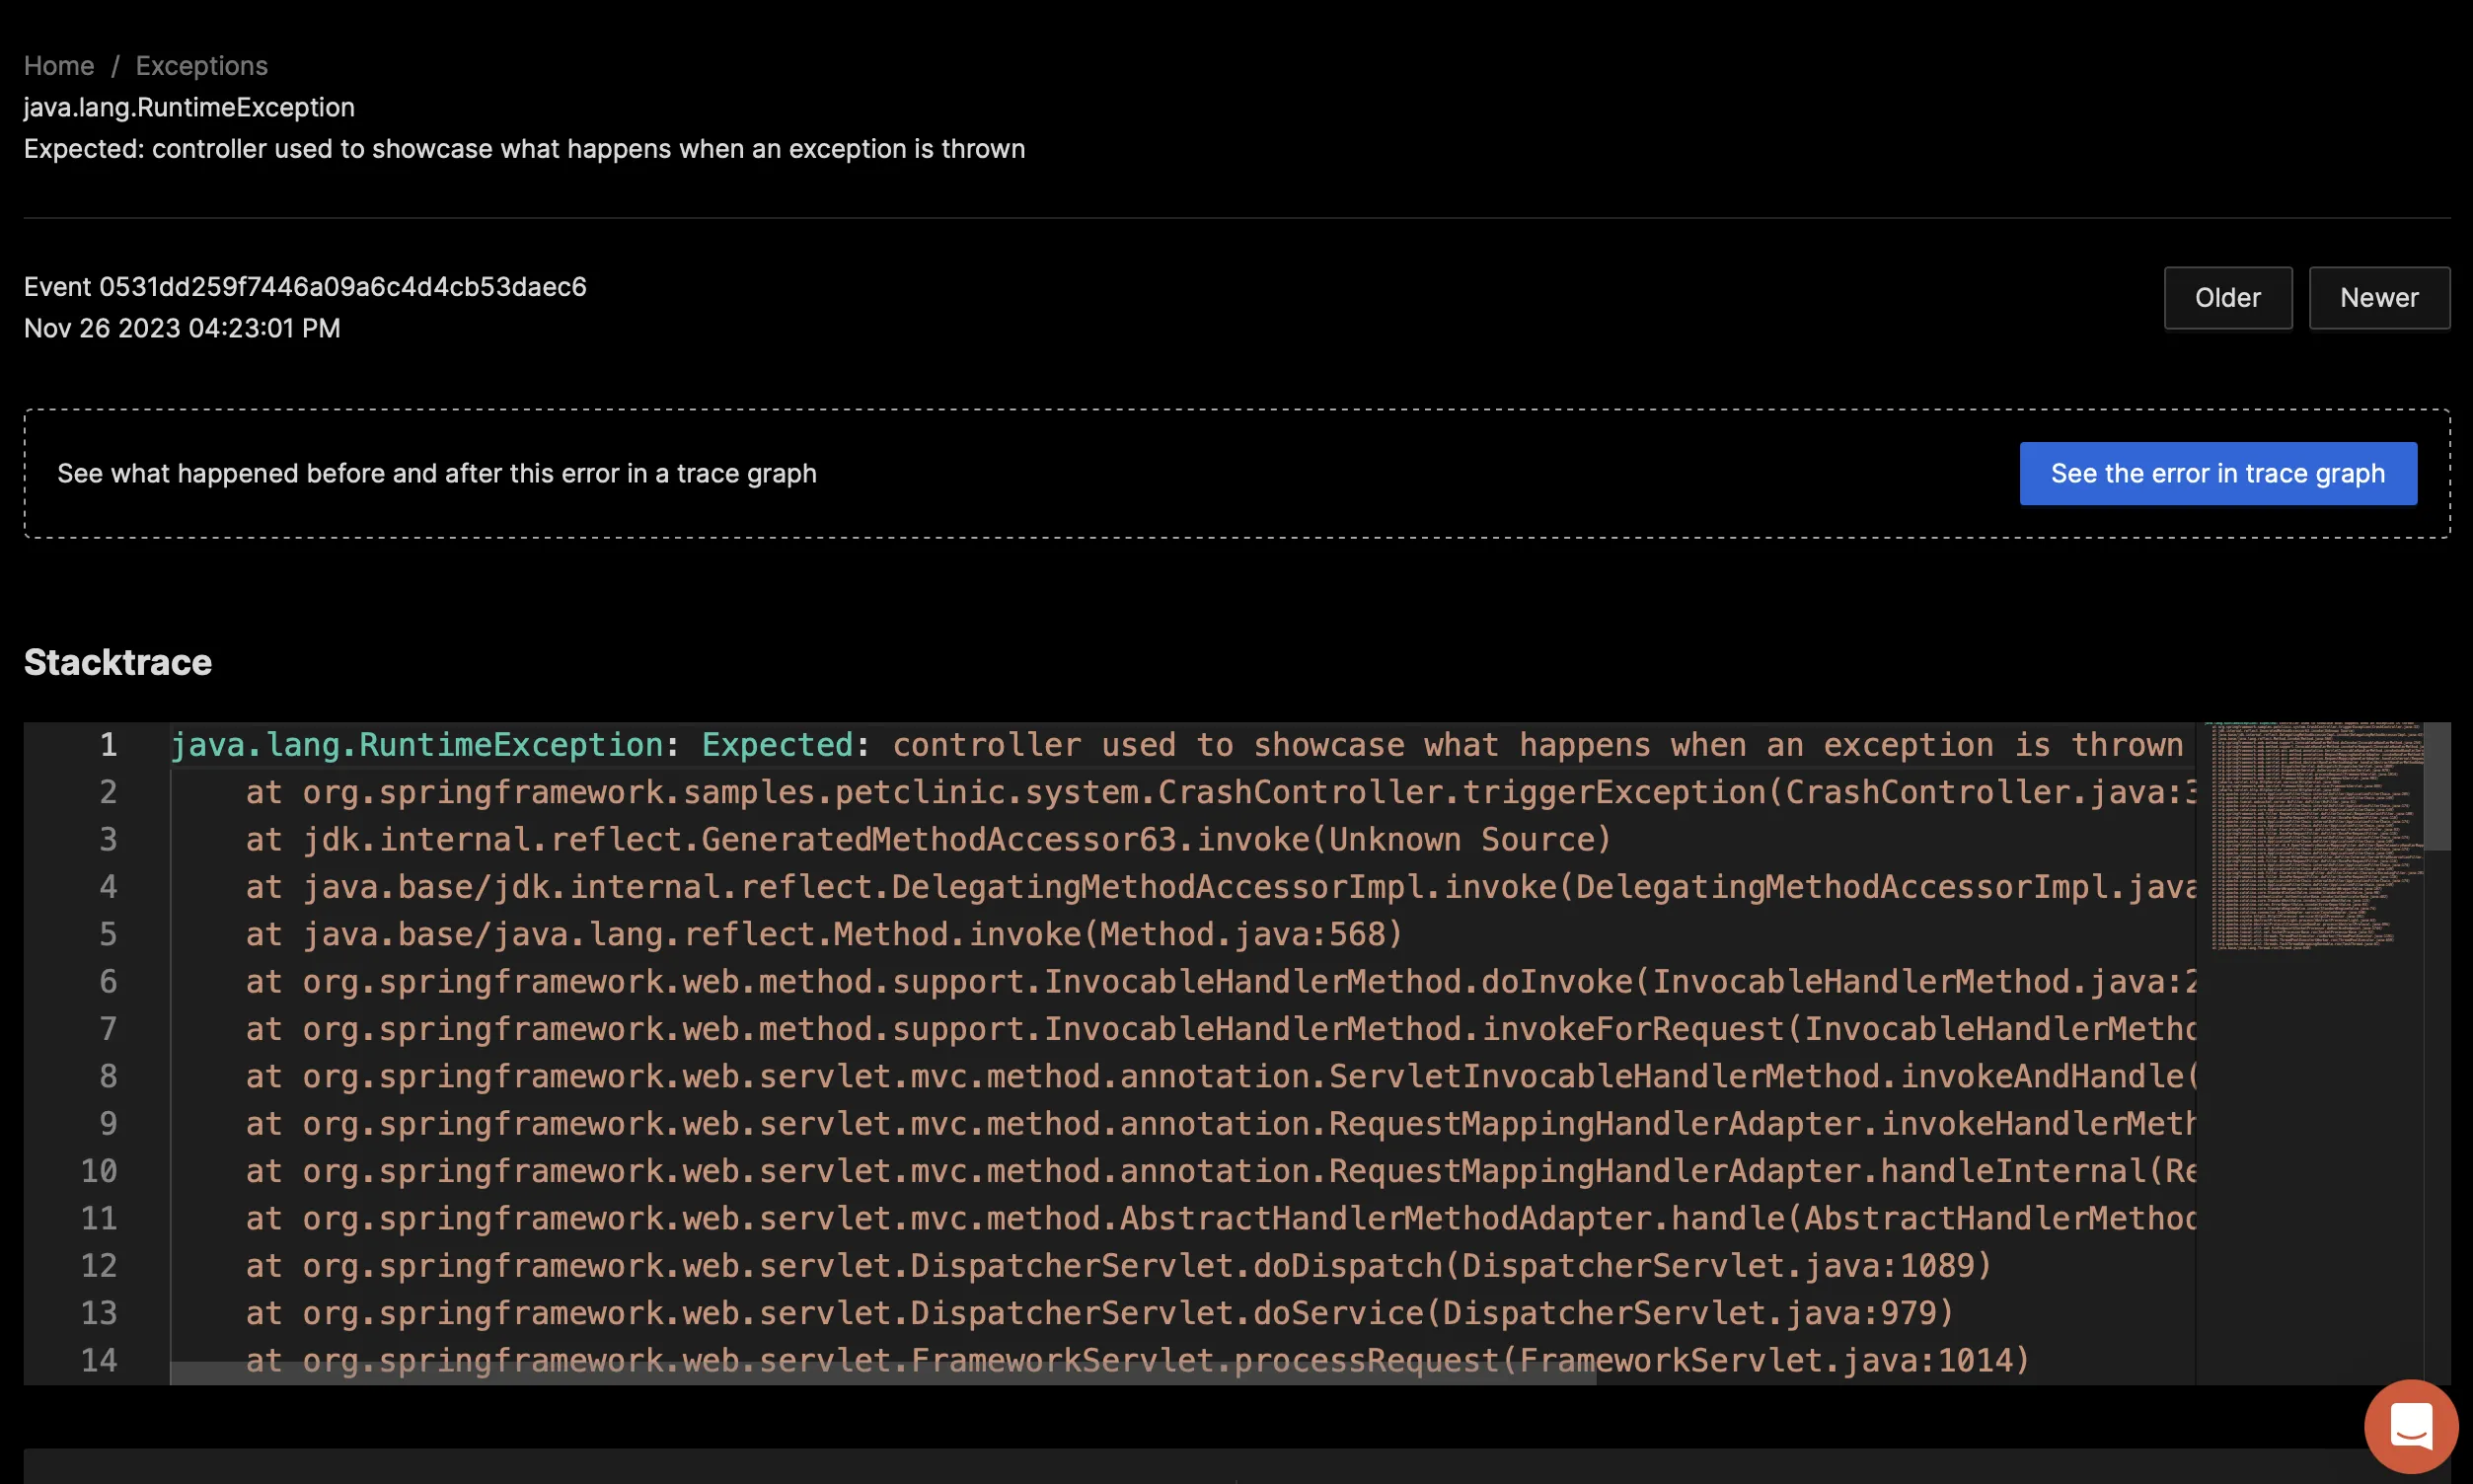
This section showcases some of the key views in SigNoz for monitoring Spring Boot Applications.
Manual Instrumentation in Spring Boot Applications
Manual instrumentation allows you to define your Spans within the code itself rather than relying on automatic instrumentation finding the entry point for a trace. Manual instrumentation is especially helpful for applications that don’t use an application server such as Tomcat, JBoss, or Jetty.
Manual instrumentation should not be needed for most Spring Boot use cases.
Important Metrics that Matter for Spring Boot Application
When running Spring Boot micro-services, it is critical to understand the following metrics to ensure a smooth running application.
Root duration:
Root duration is the server response time (AKA Server delay) for a transaction. This is the amount of time the server takes to begin streaming data back to the client without taking into account time spent on the network. This metric should be used as an SLI (Service Level Indicator).Memory allocations:
Java uses a heap for memory management split up into multiple areas, including Eden, Survivor, and Old Generation. During the application lifecycle, if an object in memory is needed for a long period of time, it will progress from Eden → Survivor → Old Generation.Garbage Collection rates:
Garbage collection is a feature of modern languages that cleans up unused memory over time to ensure that memory is available for new objects and other applications running on the same system. Stop-The-World garbage collection freezes the execution of the application to clear unused memory. Higher percentages of Stop-The-World GC will result in higher CPU utilization and higher response times. If this happens frequently, you may need to optimize your JVM settings.Available worker threads:
Worker threads are the way the application server processes requests. When a request comes in, it is allocated to a worker thread to return the response to the user. Having too few worker threads will result in a head-of-line blocking delay. Conversely, having too many worker threads will result in high resource consumption on the host and CPU scheduling delays.CPU utilization:
CPU utilization tells us how busy the system is. If we are seeing consistently high CPU utilization for an application it may degrade the performance of the application as threads wait for CPU availability. In virtual environments, watch out for CPU Steal, which is CPU contention at the hypervisor level.Exceptions:
Exceptions are thrown when an application encounters an error that has not been accounted for, such as dividing by zero or trying to open a file that doesn’t exist. Exceptions should be something that we look at to understand the health of the application, as they may trigger user-facing errors. Some exceptions may be acceptable if the code can be recovered. If in doubt, ask your developer.
Conclusion
In this article, we used OpenTelemetry to instrument a sample Spring Boot application by collecting all three signals: metrics, traces, and logs. This configuration gives us a full view of the Spring Boot application and the ability to track down application or performance problems. We also looked at the advantages of automatic instrumentation and metrics that can be used to inform Service Level Objectives and how they impact the end user.
Now that you have instrumented your Spring Boot Application, your next step can be to package your service into a container. This can be done using Docker Compose or using an orchestration platform like Kubernetes.
Further Reading
More on OpenTelemetry Java Jar Agent

